VWAP 20 EMA Strategy for Options: 5 Rules
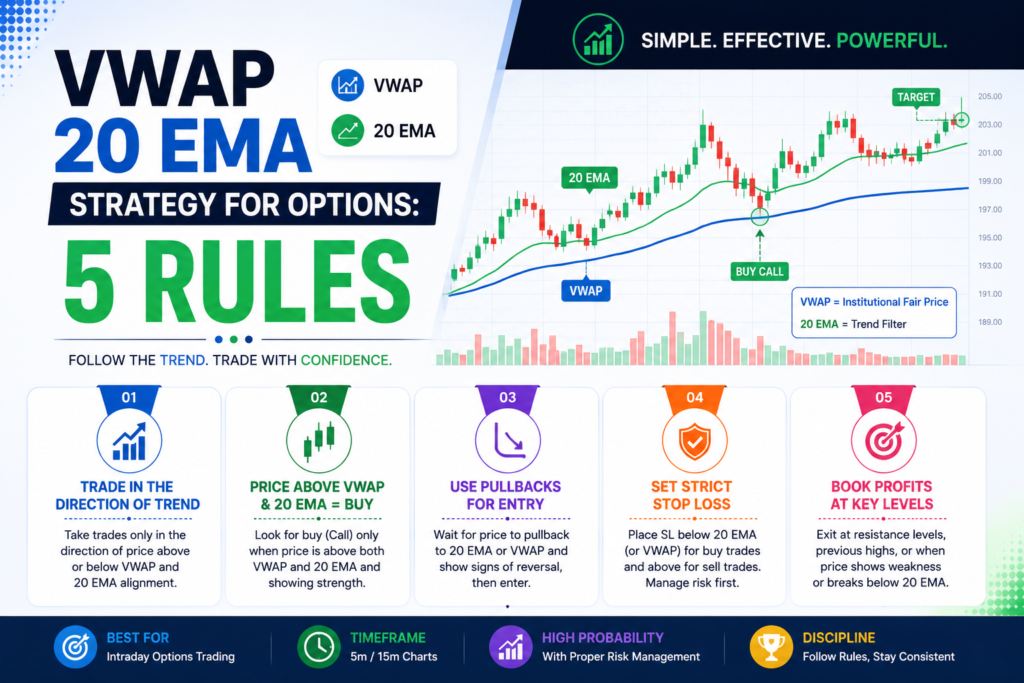
VWAP 20 EMA Strategy for Options: 5 Rules
Intraday options trading does not have to mean covering your chart with RSI, MACD, Stochastic, Supertrend, and multiple moving averages. Too many indicators can create conflicting signals and make it harder to identify the trade that actually matters.
The VWAP 20 EMA strategy for options offers a simpler approach. VWAP helps traders understand the market’s intraday price-volume context, while the 20 EMA helps identify short-term momentum.
When price stays above both indicators and the market structure is bullish, traders can look for buying opportunities after controlled pullbacks. When price remains below both indicators in a bearish structure, put setups may become more attractive. When the two indicators become flat and repeatedly cross each other, avoiding the market may be the smarter decision.
In this guide, you’ll learn how VWAP and the 20 EMA work together, how to identify Call and Put setups, where to place stop-losses, how to avoid choppy markets, and how to backtest the strategy before risking real money.
How the VWAP 20 EMA Strategy for Options Works
The VWAP 20 EMA strategy combines two technical indicators that provide different types of market information.
VWAP, or Volume Weighted Average Price, uses both price and volume to calculate an intraday average price.
The 20 EMA, or 20-period Exponential Moving Average, gives more weight to recent prices and reacts relatively quickly to changes in short-term momentum.
Instead of using several indicators that may provide conflicting signals, this strategy focuses on two basic questions:
- Is price trading above or below VWAP?
- Is short-term momentum moving higher or lower according to the 20 EMA?
The objective is not to predict the market with certainty. No indicator can do that. The objective is to create a simple framework that helps traders identify higher-quality situations and avoid unnecessary trades.
Traders who use multiple confirmations can compare the setup with momentum indicators such as MACD before taking a trade.
The VWAP 20 EMA strategy for options combines intraday price context with short-term momentum to create a structured trading approach.
How VWAP and 20 EMA Work Together
VWAP and the 20 EMA are useful together because they measure different aspects of price behavior.
VWAP: Understanding Intraday Price-Volume Context
VWAP calculates an average price based on both price and trading volume during a trading session.
Unlike a simple moving average, VWAP gives more weight to prices where greater trading volume occurred.
Professional traders and institutions may use VWAP as an execution benchmark, but traders should avoid assuming that institutions will always defend VWAP as a fixed support or resistance level.
For retail traders, VWAP is better viewed as an intraday reference point.
For example:
- Price consistently above a rising VWAP can support a bullish intraday bias.
- Price consistently below a falling VWAP can support a bearish bias.
- Price repeatedly moving around a flat VWAP can indicate a rangebound market.
VWAP therefore helps answer a simple question:
Where is price trading relative to the session’s volume-weighted reference?
20 EMA: Measuring Short-Term Momentum
The 20 EMA reacts more quickly to recent price changes than slower moving averages.
During a strong uptrend, price may repeatedly pull back toward the 20 EMA before continuing higher. During a downtrend, the same EMA can act as a dynamic resistance area.
However, the 20 EMA should not be treated as an exact line where price must reverse.
Price can move slightly through the EMA and then continue in the original direction. That is why market structure and price action should be considered alongside the indicator.
If you are new to moving averages, read our guide on SMA vs EMA to understand why an EMA reacts faster to recent price changes.
VWAP and 20 EMA Chart Setup
One of the biggest advantages of this strategy is its simplicity.
You do not need a chart filled with indicators.
A basic setup can include:
| Setting | Recommended Setup |
|---|---|
| Chart Type | Candlestick |
| Primary Timeframe | 5-minute |
| Indicator 1 | Session VWAP |
| Indicator 2 | 20-period EMA |
| Market | Liquid index, futures, or stock |
For index options, it is generally better to analyze the underlying index or futures market for the main setup instead of relying entirely on the option premium chart.
The option premium has additional variables such as time decay, implied volatility, liquidity, and sensitivity to movements in the underlying.
That means you can correctly predict the direction of the index and still get a poor result from an unsuitable option contract.
5 Rules of the VWAP 20 EMA Strategy for Options
The strategy becomes much easier to follow when you turn it into a defined process.
Rule 1: Identify the Market Direction First
Do not start by searching for a Call or Put.
Start with the underlying market.
A potential bullish environment may show:
- Price above VWAP.
- VWAP rising.
- 20 EMA rising.
- Price above the 20 EMA.
- Higher highs and higher lows.
A potential bearish environment may show:
- Price below VWAP.
- VWAP falling.
- 20 EMA falling.
- Price below the 20 EMA.
- Lower highs and lower lows.
You do not need every condition to be perfectly aligned. The purpose is to determine whether there is enough evidence of a directional market before looking for an entry.
Direction comes before execution.
Rule 2: Do Not Chase an Extended Move
This rule is particularly important for option buyers.
Imagine an index suddenly moves sharply higher. Several large bullish candles appear one after another.
A trader may feel pressure to immediately buy a Call because the market looks strong.
But strong momentum does not automatically mean a good entry.
If price is already far away from VWAP and the 20 EMA, even a normal pullback can cause the option premium to decline quickly.
Instead of chasing the move, wait for price to come back toward a logical area.
The basic idea is:
Strong trend + controlled pullback > strong trend + late entry.
You are not trying to buy the highest momentum candle. You are trying to find a location where the potential risk can be clearly defined.
Rule 3: Wait for a Pullback and Confirmation
The VWAP 20 EMA strategy for options works best when the pullback remains controlled rather than turning into a complete trend reversal.
A bullish pullback setup can develop when price is above VWAP and the 20 EMA.
The sequence can look like this:
- Price establishes above VWAP.
- The 20 EMA starts moving higher.
- Price creates an impulsive bullish move.
- Price pulls back toward the 20 EMA or VWAP.
- The pullback fails to create a meaningful bearish breakdown.
- A bullish price-action signal appears.
- The trader enters according to predefined risk rules.
Possible confirmation signals include:
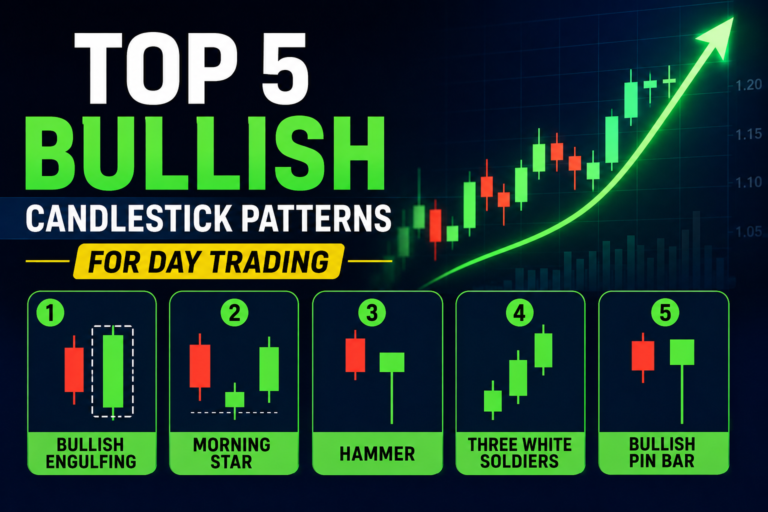
- Bullish rejection candle
- Hammer-type rejection
- Bullish engulfing candle
- Strong bullish close after a pullback
But remember: the candle pattern alone is not enough.
A bullish engulfing candle in the middle of a sideways range is very different from a bullish rejection candle that appears after a controlled pullback during an established trend.
Context matters more than the candle pattern itself.
Look for a clear price-action signal before entering, such as a rejection candle or a bullish/bearish candlestick pattern.
Rule 4: Define Your Stop-Loss Before Entry
Risk management is essential when using the VWAP 20 EMA strategy for options, because no setup guarantees a profitable trade.
For a VWAP 20 EMA strategy for options entry, wait for price confirmation instead of entering simply because the indicators have crossed.
One of the biggest mistakes traders make is deciding their stop-loss after entering the trade.
Instead, determine where your trade idea becomes invalid before entering.
For a bullish setup, the stop-loss could be below a meaningful pullback swing low.
For a bearish setup, it could be above the relevant swing high.
Avoid blindly using the same fixed stop for every trade.
For example, a two-point stop might be reasonable in one market condition but completely unrealistic in another.
Once the stop distance is known, adjust the position size according to the amount of money you are willing to risk.
Risk should determine position size, not the other way around.
A good setup can still become a bad trade if your position size is too large, so proper risk management should come before entering.
Rule 5: Have an Exit Plan
Before entering a trade, know exactly how you will manage it.
You can use a predefined risk-to-reward target, a trailing method, or a combination of both.
For example, suppose a trader decides to risk ₹500 on a trade and follows a 1:2 risk-to-reward framework.
The potential target would be ₹1,000.
This does not mean the market will always reach the target. It simply provides a consistent framework that can be tested over a large sample of trades.
Possible exit methods include:
- Fixed risk-to-reward target
- Trailing the trade using the 20 EMA
- Exiting when market structure breaks
- Taking partial profits according to a predefined plan
The key is consistency.
VWAP 20 EMA Pullback Strategy for Call Options
The pullback setup is one of the simplest ways to apply this strategy.
Instead of buying a Call after a large bullish move, you wait for price to temporarily move against the trend.
Step-by-Step Call Setup
A bullish VWAP 20 EMA strategy for options setup can occur when price holds above VWAP and the 20 EMA after a controlled pullback.
First, wait for the underlying market to establish above VWAP.
Next, check whether the 20 EMA is rising and whether price is forming higher highs and higher lows.
If the market makes a strong move higher, do not immediately chase it.
Wait for a pullback toward the 20 EMA or VWAP area.
Now observe the price action.
If sellers push price lower but fail to break important market structure, buyers may start returning.
A bullish rejection candle can then provide the trigger.
The basic setup is:
Price above VWAP → rising 20 EMA → bullish trend → pullback → bullish rejection → entry.
The stop-loss should be based on the underlying market structure rather than an arbitrary number of points.
VWAP 20 EMA Pullback Strategy for Put Options
The bearish version of the VWAP 20 EMA strategy for options looks for price rejection below VWAP and the 20 EMA.
The bearish setup works in the opposite direction.
First, price establishes below VWAP.
The 20 EMA begins moving lower and price starts creating lower highs and lower lows.
Instead of buying a Put after a large bearish candle, wait for a pullback.
Price may move back toward the 20 EMA or VWAP.
If buyers attempt to push the market higher but fail, sellers may regain control.
A bearish rejection candle can then provide the entry trigger.
The basic setup is:
Price below VWAP → falling 20 EMA → bearish trend → pullback → bearish rejection → entry.
Again, the setup should be invalidated at a logical structural level.
VWAP and 20 EMA Crossover Strategy
Before using the VWAP 20 EMA strategy for options with real money, test the rules across different market conditions.
Another way traders use these indicators is by watching for a crossover.
A bullish crossover occurs when the 20 EMA moves from below VWAP to above it.
A bearish crossover occurs when the 20 EMA moves from above VWAP to below it.
However, a crossover should not automatically be treated as a buy or sell signal.
During a sideways market, VWAP and the 20 EMA can cross several times and generate multiple false signals.
Bullish Crossover Confirmation
Look for several conditions to come together:
- 20 EMA crosses above VWAP.
- Price closes above both indicators.
- Momentum starts improving.
- Market structure begins forming higher highs and higher lows.
- Price does not immediately fall back below the indicators.
Only after confirmation should the trader consider a Call setup.
Bearish Crossover Confirmation
For a bearish setup:
- 20 EMA crosses below VWAP.
- Price closes below both indicators.
- Momentum starts weakening.
- Market structure begins forming lower highs and lower lows.
- Price does not immediately reclaim both indicators.
This provides stronger confirmation than simply trading the crossover itself.
How to Avoid Choppy Markets
Knowing when not to trade is one of the most important skills in intraday options trading.
When VWAP and the 20 EMA become flat and tangled together, the market may be rangebound.
Price can cross above VWAP and generate a bullish signal, only to fall below it a few candles later.
Then a bearish signal appears, followed by another reversal.
This can create multiple small losses.
| Market Condition | VWAP & 20 EMA | Possible Action |
|---|---|---|
| Strong Uptrend | Price > 20 EMA > VWAP | Look for Call setups |
| Strong Downtrend | Price < 20 EMA < VWAP | Look for Put setups |
| Rangebound | Indicators flat and intertwined | Avoid or reduce trades |
| Transition | Price repeatedly tests VWAP | Wait for confirmation |
If the indicators are moving sideways and price keeps crossing them, there may simply be no clear directional advantage.
Sometimes the best trade is no trade.
You can also use momentum tools such as the RSI indicator as an additional confirmation rather than relying on it as the primary entry signal.
Best Timeframe for VWAP and 20 EMA
The 5-minute timeframe is a practical starting point for many intraday traders because it provides a balance between responsiveness and noise.
However, there is no universal “best” timeframe.
| Timeframe | Possible Use | Main Limitation |
|---|---|---|
| 1-minute | Very short-term execution | More noise |
| 5-minute | Intraday trend and pullbacks | Fewer signals |
| 15-minute | Broader intraday structure | Later signals |
If you prefer the 5-minute chart for entries, you can use a higher timeframe to understand the broader market structure.
The important thing is not to add so many timeframes that your decision-making becomes complicated.
How to Choose the Right Option Contract
Identifying the correct market direction is only half the job.
You also need to select an appropriate option contract.
ATM Options
At-the-money options are often more responsive to changes in the underlying than far out-of-the-money options.
For intraday strategies, traders commonly consider ATM or appropriately ITM contracts because they can provide a more direct relationship with the underlying.
However, the right choice depends on the market, expiration, volatility, and strategy.
Avoid Choosing an Option Just Because It Is Cheap
A cheap OTM option can look attractive because the premium is low.
But a low premium does not automatically mean good value.
Before selecting an option, consider:
- Liquidity
- Bid-ask spread
- Strike price
- Expiration
- Implied volatility
- Expected movement in the underlying
A poor-quality option contract can turn a good technical setup into a difficult trade.
Before buying an option, calculate your position size for index options based on your maximum acceptable loss.
Why Your Option Can Lose Money Even When You’re Right
This is one of the most important concepts for new options traders.
Imagine you correctly predict that an index will rise.
You buy a Call option.
The index moves higher, but the move is slow and smaller than expected.
The option premium may still fail to increase enough to produce the result you expected.
Why?
Because option prices are affected by more than the direction of the underlying.
Factors such as:
- Time decay
- Implied volatility
- Option sensitivity to the underlying
- Liquidity
- Bid-ask spread
can all influence the premium.
Therefore, successful options trading requires more than simply predicting whether the market will move up or down.
Practical Example of the VWAP 20 EMA Strategy
Consider an illustrative bullish setup on a 5-minute index chart.
The market opens and initially trades near VWAP.
After some consolidation, price breaks above the morning range and starts moving higher.
The 20 EMA begins rising and price remains above both indicators.
Instead of immediately buying a Call after the breakout, the trader waits.
Price eventually pulls back toward the 20 EMA.
The pullback slows down.
A rejection wick appears, followed by a bullish candle that closes above the previous candle.
The trader now has a structured setup.
Market direction: Bullish
VWAP: Price above VWAP
20 EMA: Rising
Market structure: Higher highs and higher lows
Entry: After bullish confirmation
Stop: Below relevant pullback structure
Exit: Predefined target or tested trailing method
This example is purely illustrative. It does not mean that every similar setup will be profitable.
The important part is the process:
Trend → Pullback → Confirmation → Defined Risk → Entry → Exit
Common Mistakes to Avoid
Buying Every VWAP Touch
VWAP is not a guaranteed support or resistance level.
Price can cross it multiple times during a trading session.
Wait for context and confirmation.
Trading Every EMA Crossover
A crossover can occur repeatedly during a range.
Do not treat every crossover as a trade.
Chasing Large Candles
Large candles create emotional pressure.
You may feel that the market is going to leave without you.
But chasing an extended move can create poor risk-to-reward conditions.
Even a well-defined strategy can fail when fear, greed, or revenge trading changes your decisions, which is why controlling emotions while trading matters.
Using the Same Stop on Every Trade
Market volatility changes.
Your stop should be connected to the structure of the trade rather than an arbitrary fixed number.
Ignoring Option Liquidity
A good setup on the underlying can still be difficult to trade if the selected option has poor liquidity or a wide spread.
Increasing Position Size After a Loss
A losing trade does not mean the next trade is more likely to win.
Do not increase risk simply because you want to recover your previous loss.
Adding Too Many Indicators
The whole purpose of the VWAP and 20 EMA approach is simplicity.
If you add RSI, MACD, Stochastic, multiple EMAs, Supertrend, Bollinger Bands, and several other indicators, you may recreate the same analysis paralysis the strategy was designed to avoid.
When Should You Avoid This Strategy?
No trading strategy works equally well in every market condition.
Consider staying out when:
- VWAP is completely flat.
- The 20 EMA is flat.
- Price repeatedly crosses both indicators.
- There is no clear market structure.
- Major news is causing unpredictable price movement.
- The option has poor liquidity.
- The bid-ask spread is too wide.
- The trade has poor risk-to-reward.
- You cannot clearly identify where the setup becomes invalid.
That final point is especially important.
If you cannot explain where you are wrong, you do not have a complete trade setup.
How to Backtest the Strategy
Backtest the VWAP 20 EMA strategy for options across trending, sideways, and volatile sessions before using real capital.
Before using the strategy with real money, test the exact rules.
Do not simply look at a chart and count the trades that worked.
Define your rules first.
For every setup, record:
- Date
- Instrument
- Market condition
- VWAP direction
- 20 EMA direction
- Entry trigger
- Stop-loss
- Target
- Result
- Maximum favorable movement
- Maximum adverse movement
You should also separate trending days from rangebound days.
This can help you understand whether the strategy performs differently in different market conditions.
For example, you may discover that your pullback setup performs better during strong trends but produces many false signals when VWAP is flat.
That is valuable information.
The goal of backtesting is not to prove that the strategy always works.
The goal is to understand when it works, when it fails, and whether the results are consistent enough to justify further testing.
A temporary move against the trend does not always mean the trend has ended, so understanding pullback vs trend reversal can help prevent premature exits.
VWAP vs 20 EMA: Which Is Better?
There is no need to choose one.
They serve different purposes.
| Feature | VWAP | 20 EMA |
|---|---|---|
| Main basis | Price + Volume | Price |
| Primary use | Intraday reference | Short-term momentum |
| Typical behavior | Session-based | Continuous calculation |
| Main question | Where is price relative to VWAP? | What is recent momentum doing? |
The combination is useful because you are not asking both indicators to do the same job.
VWAP provides the broader intraday reference.
The 20 EMA provides a faster view of short-term momentum.
Price action then helps determine whether there is a potential entry.
Frequently Asked Questions
Is the VWAP 20 EMA strategy for options suitable for beginners?
The VWAP 20 EMA strategy for options can be relatively simple to understand, but beginners should practice it on historical or demo data before risking capital.
Is the VWAP 20 EMA strategy profitable?
No trading strategy guarantees profits. The VWAP and 20 EMA combination can provide a structured framework for intraday trading, but results depend on market conditions, execution, risk management, and the rules used.
What is the best timeframe for VWAP and 20 EMA?
The 5-minute chart is a practical starting point for many intraday traders. However, there is no universally best timeframe, so the setup should be tested on the market and trading style you actually use.
Should I buy Calls when price is above VWAP?
Not automatically. Price above VWAP can support a bullish bias, but you should also consider the 20 EMA, market structure, pullback quality, nearby resistance, and your risk-to-reward.
Should I buy Puts when price is below VWAP?
Price below VWAP can support a bearish bias, but it is not a standalone entry signal. A falling 20 EMA, bearish market structure, and rejection from a relevant level can provide additional confirmation.
Can I use VWAP and 20 EMA on a 1-minute chart?
Yes, but the 1-minute chart generally produces more noise and can generate more false signals. If you use it, test the exact rules carefully before applying them with real money.
Final Thoughts
The VWAP 20 EMA strategy for options is not about finding a magical combination of indicators.
It is about simplifying the decision-making process.
VWAP gives you an intraday price-volume reference. The 20 EMA helps you understand short-term momentum. Price action provides the trigger.
A simple trading process looks like this:
Identify the direction → wait for the pullback → confirm the setup → define your risk → enter → manage the trade.
The most important part, however, may be knowing when to stay out.
If VWAP and the 20 EMA are flat, price is repeatedly crossing both indicators, the option has poor liquidity, or the risk-to-reward is unattractive, there is no reason to force a trade.
Remember that a clean chart does not guarantee profitable trading. The strategy needs to be tested across different market conditions before you decide whether it fits your trading style.
If you are learning intraday options trading, start with paper or demo trading, maintain a proper trading journal, and focus on consistent risk management before increasing your position size.
Want to improve your trading process? Continue with our guide on risk management and position sizing to learn how to control your risk before entering an options trade.