MACD Indicator Explained: How to Read and Use MACD

The MACD Indicator Explained guide is designed to help traders understand one of the most popular technical indicators used in financial markets. Whether you trade stocks, forex, cryptocurrencies, or commodities, the MACD indicator can help identify trends, momentum, and potential entry and exit points.
Many professional traders rely on MACD because it combines trend-following and momentum analysis into a single tool. When used correctly, it can help traders make more informed decisions and avoid emotional trading.
In this comprehensive guide, you’ll learn what MACD is, how it works, how to read MACD signals, and practical ways to use it in your trading strategy.
If you’re new to technical analysis, you should also read our guide on Best Trading Indicators for Beginners to understand how MACD compares with other popular indicators.
According to Investopedia, the MACD indicator is one of the most widely used momentum indicators in technical analysis.
What Is the MACD Indicator?
The Moving Average Convergence Divergence (MACD) is a technical analysis indicator developed by Gerald Appel in the late 1970s.
In simple terms, the MACD Indicator Explained guide helps traders understand market momentum and trend direction.
It measures the relationship between two exponential moving averages (EMAs) and helps traders identify:
- Market trends
- Momentum strength
- Potential reversals
- Entry opportunities
- Exit opportunities
The MACD indicator is widely available on almost every trading platform, making it one of the most accessible and trusted indicators in technical analysis.
Why Is the MACD Indicator Important?
The MACD indicator is important because it helps traders understand both trend direction and momentum at the same time.
Benefits include:
- Easy to understand
- Suitable for beginners
- Works across multiple markets
- Can be used on different timeframes
- Helps confirm trading decisions
The MACD indicator is important because it helps traders understand both trend direction and momentum at the same time.
Benefits include:
- Easy to understand
- Suitable for beginners
- Works across multiple markets
- Can be used on different timeframes
- Helps confirm trading decisions
Instead of guessing where the market might move, traders can use MACD signals to make more structured and disciplined decisions.
History of the MACD Indicator
The MACD indicator was created by renowned market technician Gerald Appel.
His goal was to develop an indicator that could:
- Identify trends early
- Measure momentum changes
- Provide actionable trading signals
Over the years, MACD became one of the most widely used indicators among retail and institutional traders. Today, it remains a core component of many trading systems.
Additional educational resources on technical indicators are available through the Corporate Finance Institute (CFI), which provides detailed explanations of trading concepts.
Components of the MACD Indicator
To fully understand the MACD Indicator Explained concept, you must know its three main components.
The MACD Indicator Explained strategy relies on three components: the MACD line, signal line, and histogram.
1. MACD Line
The MACD line is calculated by subtracting the 26-period EMA from the 12-period EMA.
Formula:
MACD Line = 12 EMA − 26 EMA
This line represents momentum changes in the market.
2. Signal Line
The signal line is usually a 9-period EMA of the MACD line.
It acts as a trigger line for buy and sell signals.
3. Histogram
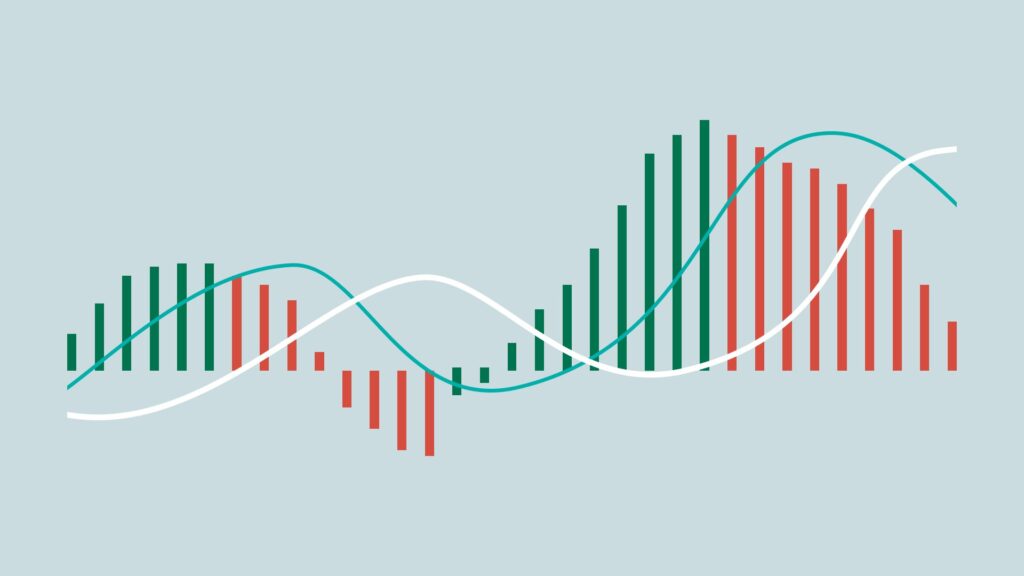
The histogram represents the difference between the MACD line and the signal line.
The histogram helps traders visualize:
- Momentum increases
- Momentum decreases
- Trend strength
- Potential reversals
Traders can explore and test MACD settings on live charts using the tools available on TradingView.
How to Read the MACD Indicator
Understanding how to read MACD correctly is essential for successful trading.
To fully understand the MACD Indicator Explained concept, traders should first learn how moving averages interact with price movements.
Bullish Signal
A bullish signal occurs when:
- MACD line crosses above the signal line
- Histogram moves above zero
This indicates increasing bullish momentum.
Bearish Signal
A bearish signal occurs when:
- MACD line crosses below the signal line
- Histogram moves below zero
This indicates growing bearish momentum.
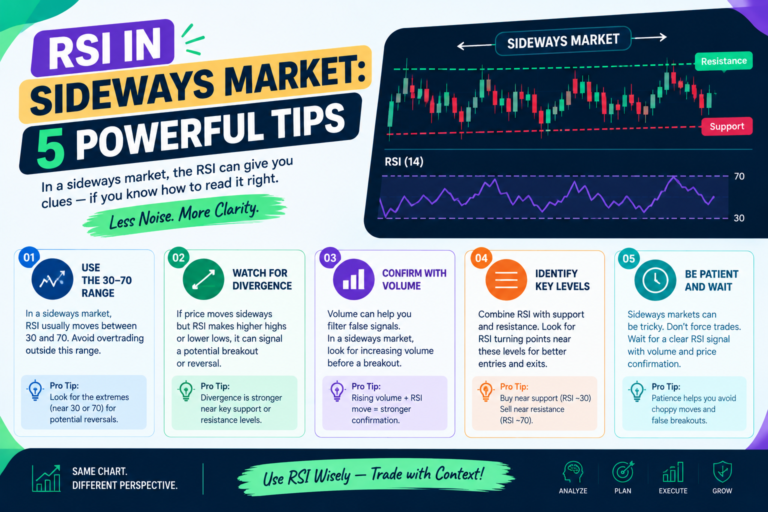
MACD is often used alongside the RSI indicator to confirm momentum changes and reduce false trading signals. Learn more in our detailed RSI Indicator Explained guide.
Understanding MACD Crossovers
One of the most popular methods in the MACD Indicator Explained framework is trading bullish and bearish crossovers.
Bullish Crossover
A bullish crossover happens when the MACD line moves above the signal line.
Many traders view this as a potential buy signal.
Bearish Crossover
A bearish crossover happens when the MACD line falls below the signal line.
Many traders interpret this as a sell signal.
MACD Zero Line Explained
The zero line is an important part of MACD analysis.
Above Zero
When MACD is above zero:
- The trend is generally bullish
- Buyers have control
- Momentum is positive
Below Zero
When MACD is below zero:
- The trend is generally bearish
- Sellers dominate
- Momentum is negative
MACD Histogram Explained
The histogram provides a visual representation of momentum.
Expanding Histogram
When histogram bars increase in size:
- Momentum is strengthening
- The current trend may continue
Shrinking Histogram
When histogram bars decrease:
- Momentum is weakening
- A reversal could be approaching
MACD Divergence: One of the Strongest Signals
Divergence occurs when price and MACD move in opposite directions.
Understanding the MACD Indicator Explained signals can help traders identify potential buying and selling opportunities.
The MACD Indicator Explained approach becomes even more powerful when divergence appears between price and momentum.
Bullish Divergence
Bullish divergence occurs when:
- Price makes lower lows
- MACD makes higher lows
This may indicate an upcoming bullish reversal.
Bearish Divergence
Bearish divergence occurs when:
- Price makes higher highs
- MACD makes lower highs
This may signal a potential bearish reversal.
Best Timeframes for MACD
The MACD indicator works across multiple timeframes.
Scalping
- 1-minute chart
- 5-minute chart
Day Trading
- 15-minute chart
- 30-minute chart
Swing Trading
- 4-hour chart
- Daily chart
Position Trading
- Weekly chart
- Monthly chart
Higher timeframes generally produce more reliable signals.
7 Powerful MACD Trading Strategies
1. MACD Crossover Strategy
This is the most common MACD strategy.
Buy Signal:
- MACD crosses above signal line
Sell Signal:
- MACD crosses below signal line
2. Zero Line Cross Strategy
Buy Setup:
- MACD crosses above zero
Sell Setup:
- MACD crosses below zero
This strategy works well in trending markets.
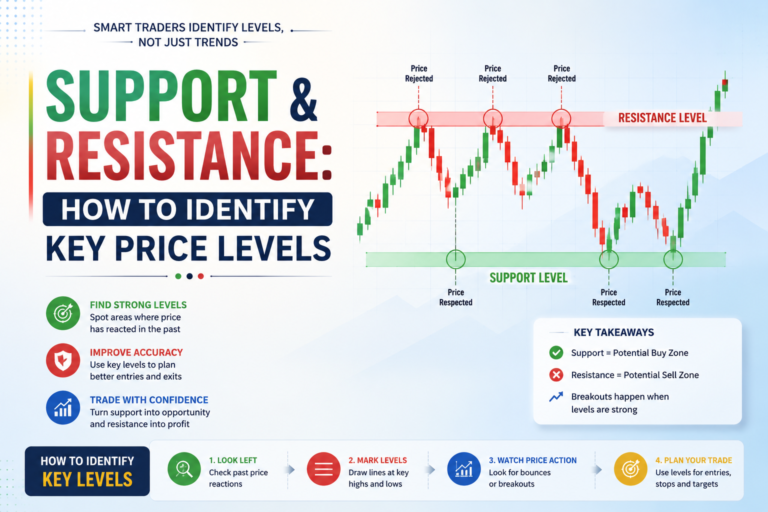
3. MACD and Support Resistance Strategy
Combine MACD with support and resistance levels.
A buy signal becomes stronger when:
- Price bounces from support
- MACD generates a bullish crossover
4. MACD Divergence Strategy
Watch for bullish and bearish divergences.
These signals often appear before major market reversals.
5. MACD and Moving Average Strategy
Use a 200 EMA for trend direction.
Only take:
- Buy trades above 200 EMA
- Sell trades below 200 EMA
Then use MACD for entry confirmation.
6. MACD Histogram Strategy
Focus on histogram expansion and contraction.
Growing histogram bars often indicate strong momentum.
7. MACD Multi-Timeframe Strategy
Analyze:
- Higher timeframe trend
- Lower timeframe entry
For example:
- Daily chart for trend
- 1-hour chart for entry
This approach can improve trade accuracy.
Before taking any MACD-based trade, make sure you understand position sizing and risk management by reading our complete guide on Risk Reward Ratio in Trading.
Common MACD Mistakes to Avoid
Many traders misuse MACD and generate poor results.
Traders often misunderstand the MACD Indicator Explained concept by relying solely on indicator signals without price action confirmation.
Many traders fail because they let emotions override their strategy. Our article on How to Control Emotions While Trading explains how to stay disciplined during winning and losing streaks.
Ignoring Market Structure
Never rely solely on MACD.
Always analyze:
- Support and resistance
- Trend direction
- Price action
Trading Every Crossover
Not every crossover leads to a profitable trade.
Wait for confirmation.
Using MACD in Sideways Markets
MACD performs best in trending markets.
During consolidation, false signals become more frequent.
Ignoring Risk Management
Even strong MACD signals can fail.
Always use:
- Stop-loss orders
- Proper position sizing
- Risk-reward ratios
Advantages of the MACD Indicator
A major reason the MACD Indicator Explained method remains popular is its ability to combine trend and momentum analysis
Easy to Use
Perfect for beginners and experienced traders.
Combines Trend and Momentum
Provides multiple insights in one indicator.
Works Across Markets
Useful for:
- Stocks
- Forex
- Commodities
- Cryptocurrencies
- Indices
Helps Confirm Trades
Can improve confidence when combined with price action.
Limitations of the MACD Indicator
Lagging Indicator
MACD uses moving averages, which means signals may come after price moves.
False Signals
Crossovers can fail in choppy markets.
Not a Standalone Tool
Best results come when combined with other forms of analysis.
Practical Example of MACD in Trading
This practical example of MACD Indicator Explained shows how traders can use momentum shifts to improve trade timing.
Imagine a stock is trending upward.
You notice:
- Price bouncing from support
- MACD bullish crossover
- Histogram turning positive
This combination provides stronger confirmation for a potential buy trade.
As the trend continues, MACD remains above zero, confirming bullish momentum.
When MACD eventually crosses below the signal line, it may be a warning that the trend is weakening.
Many professional traders use MACD as part of broader trend-following systems discussed in educational resources from Babypips.
Future of MACD Trading
Even as markets evolve, the MACD Indicator Explained strategy continues to be used by professional traders worldwide
Despite the rise of algorithmic trading and artificial intelligence, MACD remains relevant.
Modern traders continue using MACD because:
- It is simple
- It is reliable
- It adapts to multiple markets
- It complements other trading tools
Many professional trading systems still incorporate MACD as a key component for trend and momentum analysis.
Frequently Asked Questions
Is MACD good for beginners?
Yes. MACD is one of the easiest indicators for beginners to understand and use.
Which MACD setting is best?
The standard setting (12, 26, 9) works well for most traders.
Can MACD predict market reversals?
MACD cannot predict the future, but divergence signals can warn of potential reversals.
Is MACD better than RSI?
Neither is better. MACD measures trend and momentum, while RSI measures overbought and oversold conditions.
Can MACD be used for scalping?
Yes. Many scalpers use MACD on lower timeframes alongside price action.
Conclusion
This MACD Indicator Explained guide covered everything from MACD basics to advanced trading strategies. The indicator remains one of the most effective tools for identifying momentum shifts, trend direction, and potential trading opportunities.
For continued learning, you can explore technical analysis tutorials and charting tools from TradingView Academy and other trusted educational platforms.
Remember that MACD should not be used alone. Combining MACD with price action, support and resistance, and proper risk management can significantly improve trading performance.
Mastering MACD takes practice, but once understood, it can become a valuable part of your trading toolkit.
This MACD Indicator Explained guide has covered everything from basic concepts to advanced trading strategies.
To build a complete trading system, combine MACD with other proven tools and strategies discussed in our Trading Psychology Guide for Beginners.
Call to Action
If you found this MACD Indicator Explained guide helpful, explore our other trading education articles to strengthen your technical analysis skills. Share this article with fellow traders and leave a comment about your favorite MACD strategy.
Frequently Asked Questions (FAQs)
1. What is the MACD indicator in simple terms?
The MACD (Moving Average Convergence Divergence) indicator is a technical analysis tool that helps traders identify trends, momentum, and potential buy or sell signals. It compares two moving averages to show changes in market direction.
2. How does the MACD indicator work?
The MACD indicator works by measuring the relationship between a 12-period EMA and a 26-period EMA. The difference between these averages forms the MACD line, which is then compared with the signal line to generate trading signals.
3. What is a bullish MACD crossover?
A bullish MACD crossover occurs when the MACD line crosses above the signal line. This often indicates increasing buying momentum and may signal a potential upward price movement.
4. What is a bearish MACD crossover?
A bearish MACD crossover occurs when the MACD line crosses below the signal line. This suggests weakening bullish momentum and may indicate a possible downward trend.
5. What does the MACD histogram tell traders?
The MACD histogram shows the difference between the MACD line and the signal line. Expanding bars indicate strengthening momentum, while shrinking bars may signal a weakening trend or a potential reversal.
6. What is MACD divergence?
MACD divergence occurs when price moves in the opposite direction of the MACD indicator. Bullish divergence may signal an upcoming upward reversal, while bearish divergence may indicate a potential downward reversal.
7. Which timeframe is best for the MACD indicator?
The MACD indicator works on all timeframes. Scalpers often use 1-minute and 5-minute charts, while swing traders prefer 4-hour and daily charts for more reliable signals.
8. Is MACD suitable for beginners?
Yes, MACD is one of the best indicators for beginners because it is easy to understand and helps identify both trend direction and market momentum.
9. Can MACD be used for forex trading?
Yes, MACD is widely used in forex trading. It helps traders identify trend strength, momentum shifts, and potential entry and exit points in currency pairs.
10. Is MACD better than RSI?
MACD and RSI serve different purposes. MACD focuses on trend and momentum, while RSI measures overbought and oversold conditions. Many traders combine both indicators for stronger trade confirmation.
11. What are the best MACD settings?
The standard MACD settings of 12, 26, and 9 are the most commonly used. These settings work effectively across stocks, forex, cryptocurrencies, and commodities.
12. Can the MACD indicator predict market reversals?
MACD cannot predict reversals with complete accuracy, but divergence signals and crossover patterns can provide early warnings of potential trend changes.
13. Does MACD work for day trading?
Yes, day traders frequently use MACD to identify short-term momentum and trend direction. It is often combined with support and resistance levels for better accuracy.
14. Can MACD be used for swing trading?
Absolutely. Swing traders use MACD to capture medium-term trends and identify high-probability entry and exit points over several days or weeks.
15. What are the limitations of the MACD indicator?
The MACD indicator is a lagging indicator because it is based on moving averages. During sideways or choppy markets, it may generate false signals, which is why traders should combine it with other analysis tools.
16. How can I improve MACD trading accuracy?
You can improve MACD accuracy by combining it with price action, support and resistance levels, trend analysis, proper risk management, and confirmation from other indicators such as RSI.
Recommended Trading Tool:
“Want to practice reading these market concepts on live charts? TradingView offers free real-time charts, stock screeners, and paper trading.”