Moving Average Explained: 7 Proven SMA vs EMA Secrets
Introduction 🚀
If you are new to trading, one of the first indicators you will encounter is the Moving Average. It is one of the most popular technical analysis tools used by traders and investors worldwide. Whether you trade stocks, forex, commodities, cryptocurrencies, or indices, understanding moving averages can significantly improve your market analysis.
In this comprehensive guide, we will explain Moving Average Explained: SMA vs EMA, how they work, their advantages and disadvantages, and how traders use them to identify trends, support and resistance levels, and trading opportunities.
By the end of this article, you will clearly understand the difference between the Simple Moving Average (SMA) and the Exponential Moving Average (EMA) and know when to use each one in your trading strategy.
What Is a Moving Average? 📊
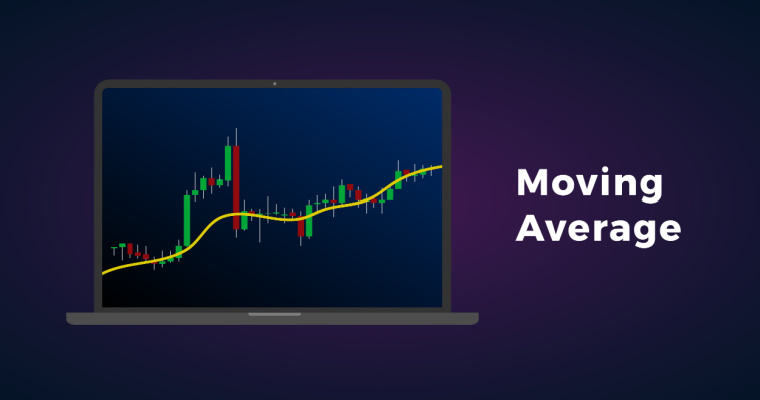
A Moving Average (MA) is a technical indicator that smooths out price fluctuations by calculating the average price over a specific period.
Instead of focusing on every price movement, a moving average helps traders identify the overall direction of the market.
Example:
Suppose a stock closes at:
- Day 1: ₹100
- Day 2: ₹105
- Day 3: ₹110
- Day 4: ₹115
- Day 5: ₹120
The 5-day moving average would be:
(100 + 105 + 110 + 115 + 120) ÷ 5 = ₹110
This average moves forward as new price data becomes available.
✅ Helps identify trends
✅ Reduces market noise
✅ Improves decision-making
✅ Useful for beginners and professionals alike
According to Investopedia, moving averages are among the most widely used technical indicators for identifying trends and smoothing market noise.
Why Are Moving Averages Important? 🎯
Moving averages are widely used because they help traders:
✔ Identify market trends
✔ Spot potential reversals
✔ Confirm trade entries
✔ Determine support and resistance
✔ Filter out false signals
Without moving averages, many traders find it difficult to identify the true direction of the market.
Many traders misuse moving averages because of emotional decisions, which is why mastering Trading Psychology is just as important as learning technical indicators.
History of Moving Averages 📚
The concept of moving averages originated from statistical analysis long before modern financial markets existed.
As financial markets evolved, analysts began using moving averages to smooth price fluctuations and detect long-term trends.
Today, moving averages are integrated into almost every trading platform, including:
- TradingView
- MetaTrader 4
- MetaTrader 5
- NinjaTrader
- ThinkorSwim
Because of their simplicity and effectiveness, moving averages remain one of the most trusted indicators in technical analysis.
Types of Moving Averages 🔍
There are many types of moving averages, but the two most commonly used are:
1. Simple Moving Average (SMA)
2. Exponential Moving Average (EMA)
Understanding the difference between SMA and EMA is essential for every trader.
What Is SMA (Simple Moving Average)? 📈
The Simple Moving Average (SMA) calculates the average closing price over a specific number of periods.
SMA Formula
SMA = Sum of Closing Prices ÷ Number of Periods
Example
Suppose the last five closing prices are:
100, 102, 104, 106, 108
SMA = (100 + 102 + 104 + 106 + 108) ÷ 5
SMA = 104
Every price receives equal importance.
Characteristics of SMA
✅ Smooth trend representation
✅ Less sensitive to sudden price changes
✅ Ideal for long-term traders
✅ Easy to understand
Advantages of SMA ✅
1. Easy to Calculate
The formula is straightforward and beginner-friendly.
2. Reduces Market Noise
SMA filters random price fluctuations effectively.
3. Excellent for Long-Term Trends
Many investors use 50-day and 200-day SMA to analyze long-term market direction.
4. Reliable Support and Resistance
Price often reacts around major SMA levels.
Disadvantages of SMA ❌
1. Slow Reaction
SMA responds slowly to market changes.
2. Lagging Indicator
Signals often appear after the move has already started.
3. Misses Early Entries
Traders may enter trades late due to delayed signals.
What Is EMA (Exponential Moving Average)? ⚡
The Exponential Moving Average (EMA) gives more weight to recent prices.
Because recent prices receive higher importance, EMA reacts much faster to market movements than SMA.
Key Feature
Recent price data has greater influence.
This makes EMA more responsive and popular among short-term traders.
Characteristics of EMA 📉
✅ Faster than SMA
✅ Reacts quickly to price changes
✅ Ideal for scalpers and day traders
✅ Better for fast-moving markets
Advantages of EMA ✅
1. Faster Signals
EMA detects trend changes earlier than SMA.
2. Better for Intraday Trading
Scalpers and day traders prefer EMA because of its responsiveness.
3. Works Well in Trending Markets
EMA helps traders enter trends sooner.
4. Popular Among Professional Traders
Many institutional traders rely on EMA-based strategies.
Disadvantages of EMA ❌
1. More False Signals
EMA may react to temporary market fluctuations.
2. Sensitive to Volatility
Strong volatility can create misleading signals.
3. Requires Confirmation
EMA signals should be confirmed with price action or other indicators.
SMA vs EMA: Key Differences ⚔️
| Feature | SMA | EMA |
|---|---|---|
| Speed | Slower | Faster |
| Sensitivity | Lower | Higher |
| Weight Given | Equal | More weight to recent prices |
| Best For | Long-term investing | Short-term trading |
| False Signals | Fewer | More |
| Trend Detection | Delayed | Early |
Quick Summary
📌 SMA = Smoother but slower
📌 EMA = Faster but more sensitive
Which Is Better: SMA or EMA? 🤔
There is no universally better moving average.
The best choice depends on your trading style.
Use SMA If:
✔ You are a long-term investor
✔ You prefer fewer signals
✔ You trade daily or weekly charts
✔ You want smoother trend analysis
Use EMA If:
✔ You are a scalper
✔ You are a day trader
✔ You need faster signals
✔ You trade volatile markets
Best Moving Average Settings for Traders 📊
Different moving averages serve different purposes.
9 EMA
- Popular for scalping
- Fast trend identification
20 EMA
- Short-term trend analysis
- Frequently used by day traders
50 EMA
- Medium-term trend
- Strong dynamic support/resistance
100 EMA
- Long-term trend confirmation
200 EMA
- Widely used by institutions
- Major trend indicator
50 SMA
- Swing trading
- Trend analysis
200 SMA
- Long-term investing
- Market direction confirmation
You can practice SMA and EMA strategies on live charts using TradingView, one of the most popular charting platforms among traders worldwide.
Moving Average Crossover Strategy 🔥
One of the most popular strategies is the crossover strategy.
Traders often combine moving average crossovers with the MACD Indicator Explained strategy to confirm trend strength and reduce false trading signals.
Golden Cross 🟢
Occurs when a shorter moving average crosses above a longer moving average.
Example:
- 50 SMA crosses above 200 SMA
This often signals a bullish trend.
Why Traders Like It
✔ Strong trend confirmation
✔ Popular among investors
✔ Easy to identify
Death Cross 🔴
Occurs when a shorter moving average crosses below a longer moving average.
Example:
- 50 SMA crosses below 200 SMA
This often signals bearish market conditions.
Using Moving Averages as Support and Resistance 🛡️
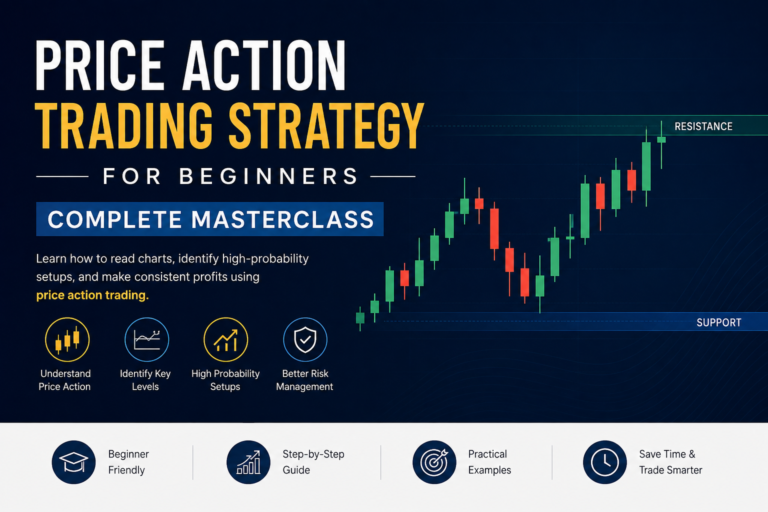
Moving averages often act as dynamic support and resistance levels.
In Uptrends
Price frequently bounces from:
- 20 EMA
- 50 EMA
- 200 EMA
In Downtrends
Price often rejects from these moving averages.
Many professional traders use moving averages to find low-risk entries.
Combining SMA and EMA for Better Results 🎯
Many traders use both indicators together.
Example Setup
- 20 EMA for short-term trend
- 50 SMA for overall trend direction
This combination helps traders balance speed and reliability.
Benefits include:
✅ Better trend confirmation
✅ Reduced false signals
✅ Improved trade entries
Common Mistakes Traders Make ❌
1. Using Too Many Moving Averages
Charts become cluttered and confusing.
2. Trading Every Crossover
Not every crossover leads to a profitable trend.
3. Ignoring Market Structure
Always analyze support, resistance, and price action.
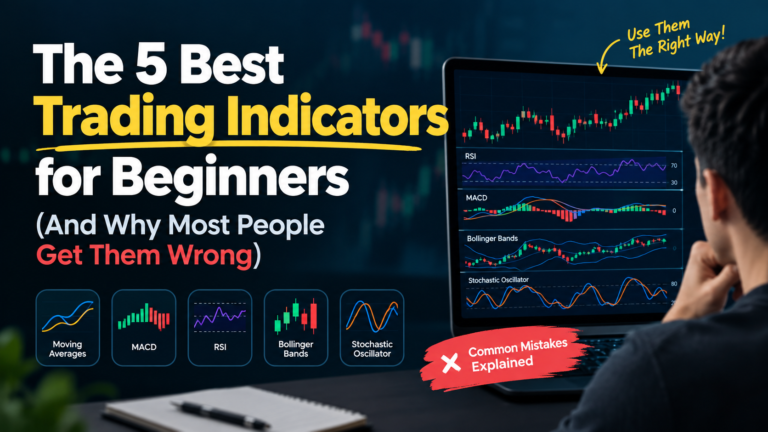
4. Using Moving Averages Alone
Combine them with:
- RSI
- MACD
- Volume Analysis
- Price Action
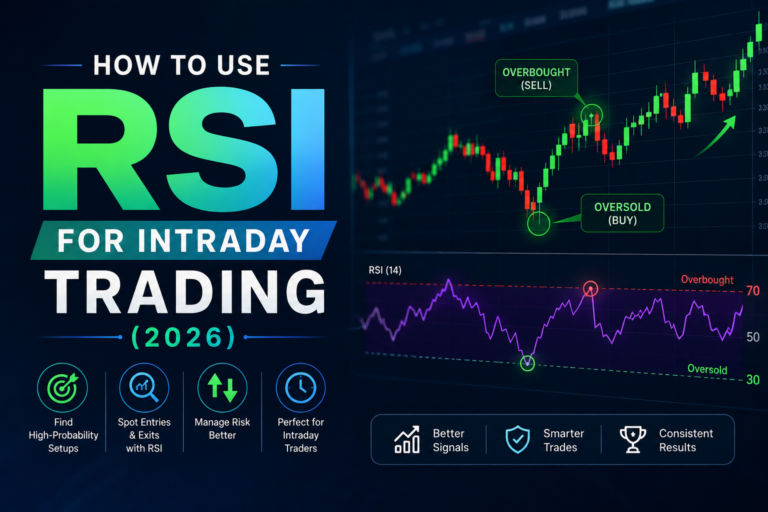
While moving averages help identify trends, combining them with the RSI Indicator Explained guide can help traders identify overbought and oversold market conditions for better trade confirmation.
Practical Example of SMA vs EMA 📚
Imagine gold (XAUUSD) suddenly moves upward due to strong market news.
SMA Reaction
- Responds slowly
- Gives signal later
EMA Reaction
- Responds quickly
- Gives earlier signal
This is why intraday traders often choose EMA over SMA.
However, EMA may also create false signals during volatile conditions.
Forex traders can further improve their understanding of moving averages through the free educational lessons available on Babypips.
Current Use of Moving Averages in Modern Trading 🌍
Today, moving averages are used by:
- Retail traders
- Swing traders
- Day traders
- Hedge funds
- Investment firms
- Algorithmic trading systems
Many automated trading strategies use moving averages as a primary trend filter.
Their simplicity and effectiveness continue to make them one of the most trusted indicators in financial markets.
Future of Moving Averages 🚀
Although new technologies and AI-driven systems are emerging, moving averages remain highly relevant.
Future developments may include:
✅ AI-enhanced moving average systems
✅ Automated trend detection
✅ Algorithmic crossover strategies
✅ Advanced adaptive moving averages
However, the fundamental principle of trend identification will likely remain unchanged.
How to Use Moving Averages Effectively in Trading 📊
Understanding the difference between SMA and EMA is important, but knowing how to use them effectively in real market conditions is what separates successful traders from beginners. Moving averages are not just trend indicators; they can help traders identify entry points, exit points, and overall market direction.
1. Identify the Overall Trend 📈
One of the most common uses of moving averages is trend identification.
Uptrend
When the price stays above a moving average and the moving average is sloping upward, the market is generally considered bullish.
For example:
- Price above 50 EMA
- 50 EMA above 200 EMA
This setup often indicates strong buying momentum.
Downtrend
When the price remains below a moving average and the moving average points downward, the market is usually bearish.
For example:
- Price below 50 EMA
- 50 EMA below 200 EMA
This setup suggests sellers are controlling the market.
Using moving averages as a trend filter can help traders avoid taking trades against the dominant market direction.
2. Find Better Entry Opportunities 🎯
Many traders use moving averages to find high-probability trade entries.
Instead of chasing price movements, traders wait for the market to pull back toward a moving average before entering a trade.
Example
Suppose EUR/USD is in a strong uptrend.
A trader may wait for the price to retrace toward the 20 EMA before looking for a buying opportunity.
This approach often provides:
✅ Better risk-to-reward ratios
✅ Smaller stop losses
✅ Higher probability entries
3. Use Moving Averages for Dynamic Support and Resistance 🛡️
Unlike traditional support and resistance levels that remain fixed, moving averages continuously adjust as the market moves.
Many traders observe that:
- The 20 EMA often acts as support during strong trends.
- The 50 EMA frequently serves as medium-term support.
- The 200 EMA is considered a major support and resistance level.
Institutional traders and large investors closely monitor these levels, making them important areas of interest in the market.
4. Confirm Signals with Other Indicators 🔍
Although moving averages are powerful, relying solely on them can lead to false signals.
Professional traders often combine moving averages with:
- RSI (Relative Strength Index)
- MACD (Moving Average Convergence Divergence)
- Volume Analysis
- Price Action Patterns
For instance, if the 20 EMA crosses above the 50 EMA while RSI confirms bullish momentum, the trading signal becomes stronger.
This multi-indicator approach improves trade accuracy and reduces unnecessary losses.
5. Avoid Common Beginner Mistakes ❌
Many beginners believe moving averages can predict the future. In reality, they are lagging indicators that follow price action.
To use moving averages effectively:
✔ Do not trade every crossover.
✔ Always follow proper risk management.
✔ Consider overall market structure.
✔ Avoid overloading charts with too many moving averages.
✔ Focus on quality setups rather than quantity.
Successful traders understand that moving averages work best when combined with discipline, patience, and a well-defined trading plan.
Frequently Asked Questions (FAQs) ❓
Which moving average is best for beginners?
The 50 SMA and 200 SMA are excellent starting points for beginners because they provide clear trend direction.
Is EMA better than SMA?
Not necessarily. EMA is faster, while SMA is smoother and more reliable for long-term trend analysis.
Which moving average is best for day trading?
Most day traders prefer the 9 EMA and 20 EMA because they react quickly to price movements.
Can I use SMA and EMA together?
Yes. Many professional traders combine SMA and EMA for better trend confirmation.
Does moving average work in all markets?
Yes. Moving averages can be used in stocks, forex, commodities, cryptocurrencies, and indices.
What is the most popular moving average?
The 200 EMA and 200 SMA are among the most widely followed moving averages in financial markets.
Conclusion 🎯
Understanding Moving Average Explained: SMA vs EMA is essential for anyone serious about trading. Both indicators help traders identify trends, filter market noise, and improve decision-making.
The Simple Moving Average (SMA) is smoother and ideal for long-term analysis, while the Exponential Moving Average (EMA) reacts faster and is preferred by short-term traders.
Instead of asking which is better, focus on which one suits your trading style. Many successful traders use both SMA and EMA together to gain a complete view of the market.
Remember, no indicator is perfect. Always combine moving averages with proper risk management, price action analysis, and a disciplined trading plan for the best results.
Even the best moving average strategy can fail without proper risk management, so understanding the Risk Reward Ratio in Trading is essential for long-term profitability.
Key Takeaways 📌
✅ SMA gives equal weight to all prices.
✅ EMA gives more weight to recent prices.
✅ SMA is slower but smoother.
✅ EMA is faster but more sensitive.
✅ Both indicators help identify trends.
✅ Combining SMA and EMA can improve trading decisions.
✅ Moving averages work best when used with risk management and price action.
🚀 Call to Action
Did you find this guide on Moving Average Explained: SMA vs EMA helpful?
💬 Leave a comment below and share your favorite moving average strategy.
📢 Share this article with fellow traders.
📧 Subscribe to our newsletter for more trading guides, market insights, and professional trading tips.
⭐ Bookmark this page so you can revisit it whenever you need a quick refresher on moving averages.