Price Action Trading Strategy for Beginners: Complete Masterclass
Introduction
A price action trading strategy focuses on reading raw price movement.
If your chart has RSI, MACD, moving averages, Bollinger Bands, and five more indicators fighting for attention, it may be time to simplify. A price action trading strategy starts with the chart itself: where price moves, where it reacts, and how buyers and sellers behave. Instead of waiting for lagging indicators to confirm a move after it has already started, price action traders study market structure, support and resistance, candles, liquidity, and momentum. This approach does not promise every trade will win, but it gives beginners a cleaner framework for making decisions.
1. The Core Pillars of Price Action: Market Structure 📊
Understanding market structure is the foundation of a reliable price action trading strategy.
The foundation of any price action trading strategy is market structure. Before looking for an entry, ask one simple question:
Is price making higher highs, lower lows, or moving sideways?
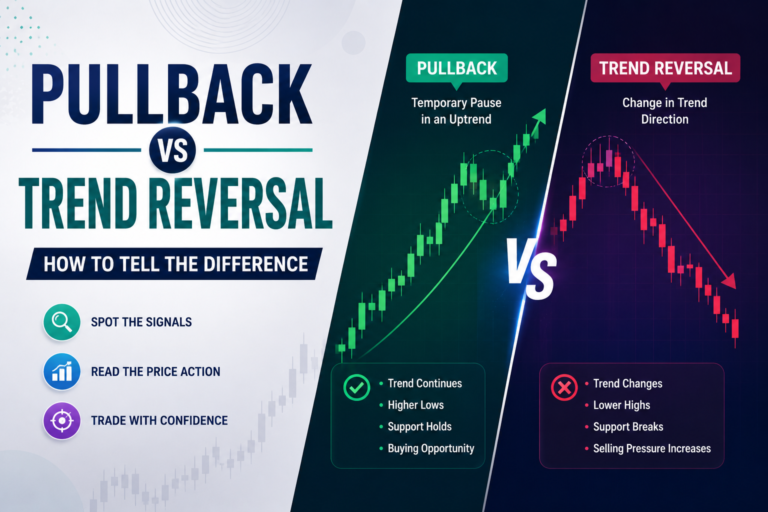
📈 Uptrend: Higher Highs and Higher Lows
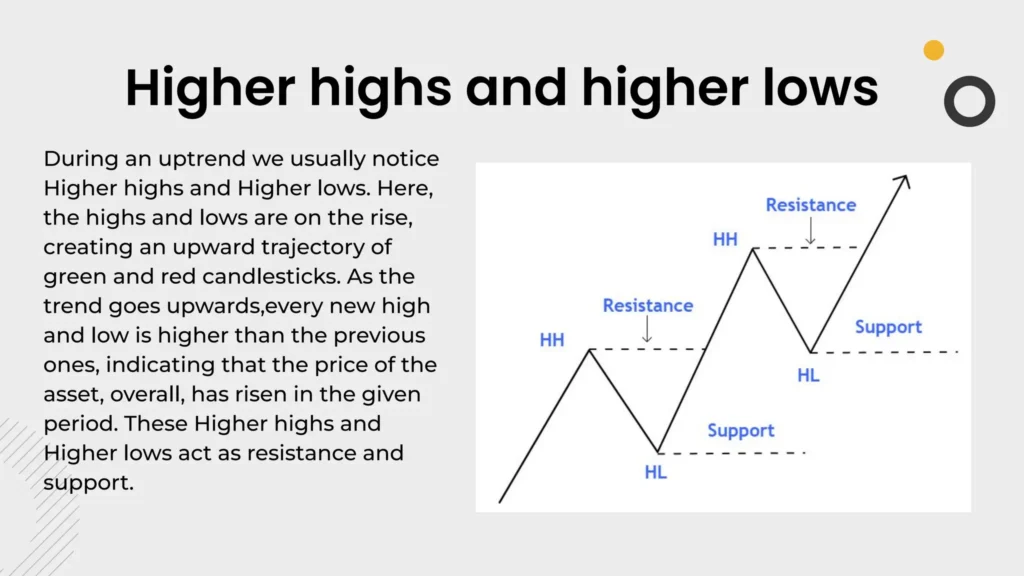
An uptrend develops when buyers consistently push price upward.
The basic sequence is:
Higher High (HH) → Higher Low (HL) → Higher High (HH) → Higher Low (HL)
For example, imagine Nifty 50 moves from 24,000 to 24,300, pulls back to 24,150, and then rallies to 24,500. The 24,300 and 24,500 levels are higher highs, while 24,150 is a higher low.
A trader using market structure trading would generally look for buying opportunities during controlled pullbacks rather than blindly buying after a large green candle.
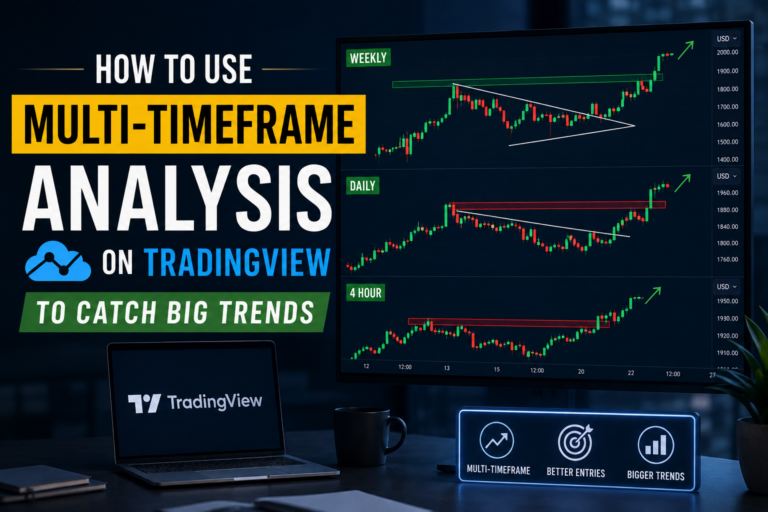
multi-timeframe analysis on TradingView
💡 Trader’s First-Hand Insight:
A common situation in Nifty 50 is a strong morning rally followed by a pullback. A trader watching market structure may notice that price holds above the previous swing low and forms another higher low. An indicator may still be adjusting, but the structure itself already shows that buyers remain active. That information can prevent an unnecessary short trade.
📉 Downtrend: Lower Highs and Lower Lows
A downtrend is the opposite:
Lower Low (LL) → Lower High (LH) → Lower Low (LL) → Lower High (LH)
Sellers are controlling the market because every meaningful bounce fails below the previous swing high.
Rather than trying to predict the exact bottom, a price action trader waits for the market to prove that buyers are gaining control.
↔️ Sideways Consolidation
Sometimes neither buyers nor sellers dominate.
Price repeatedly moves between a defined upper and lower area. This is called consolidation or a range.
| Market Condition | Structure | Trader’s Focus |
|---|---|---|
| 📈 Uptrend | HH + HL | Look for bullish pullbacks |
| 📉 Downtrend | LH + LL | Look for bearish rallies |
| ↔️ Sideways | Repeated range highs/lows | Wait for rejection or breakout |
💡 Trader’s First-Hand Insight:
During a stock’s sideways phase, indicators can repeatedly switch between bullish and bearish signals. Price action makes the situation simpler: if the same resistance zone keeps rejecting price and the same support zone keeps attracting buyers, the market is ranging. Waiting for confirmation is often safer than trading every indicator crossover.
2. The 3-Step Price Action Execution Setup 🎯
Understanding structure is only half the job. You also need a repeatable entry process.
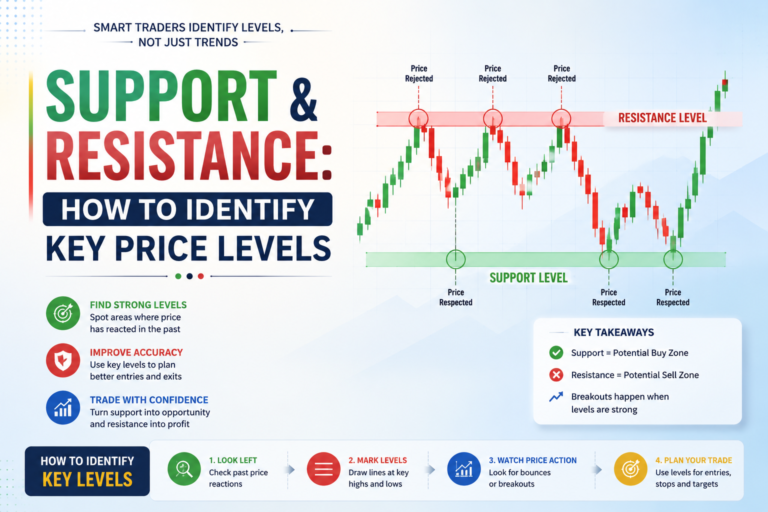
Step 1: Identify Key Support and Resistance Zones
Do not cover your chart with dozens of thin horizontal lines.
Instead, mark support and resistance as zones.
A support zone is an area where buyers have previously stepped in strongly. Resistance is an area where sellers have previously appeared.
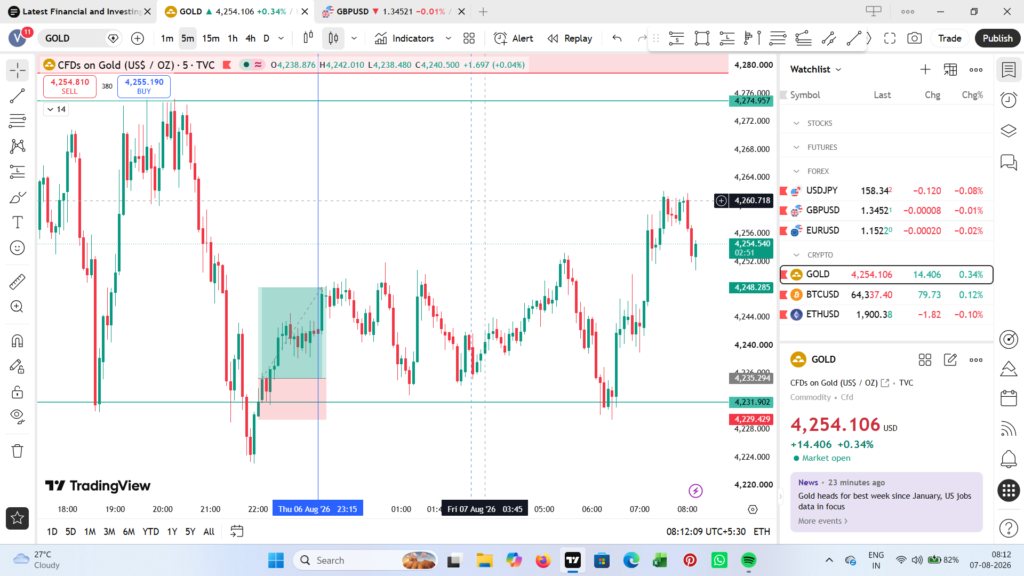
Use a rectangle to mark the area where several candles reacted rather than trying to identify one perfect price
What Should You Look For?
📌 Previous swing highs
📌 Previous swing lows
📌 Strong rejection areas
📌 Breakout and retest zones
📌 Areas where price made a sharp impulsive move
💡 Trader’s First-Hand Insight:
Suppose a stock breaks above ₹500 and later returns toward the ₹500–₹505 area. Instead of treating ₹500 as a magical number, a price action trader watches the entire reaction zone. If sellers fail to push price back below the zone and buyers produce strong rejection, the area may become a useful location for a long setup.
Step 2: Wait for Price Reaction ⚠️
Never enter simply because price has reached your zone.
Support and resistance zones are essential parts of a practical price action trading strategy.
This is where patience becomes important.
Look for evidence such as:
- Liquidity sweep: Price briefly moves beyond a previous high or low and quickly returns.
- Rejection: A long wick shows that price was pushed away from an area.
- Consolidation: Price pauses near support or resistance before making its next move.
- Break and retest: Price breaks a level and later tests it from the opposite side.
The objective is not to predict the market. Your objective is to wait until the market gives you information.
💡 Trader’s First-Hand Insight:
A trader may see Nifty 50 dip below a previous swing low and immediately assume the downtrend will continue. But if the candle closes back above that low and the next candle shows buying strength, the initial breakdown may have been a liquidity sweep. Reading the actual reaction can keep a trader from selling directly into a failed breakdown.
Step 3: Use a Trigger Candle for Entry 📈
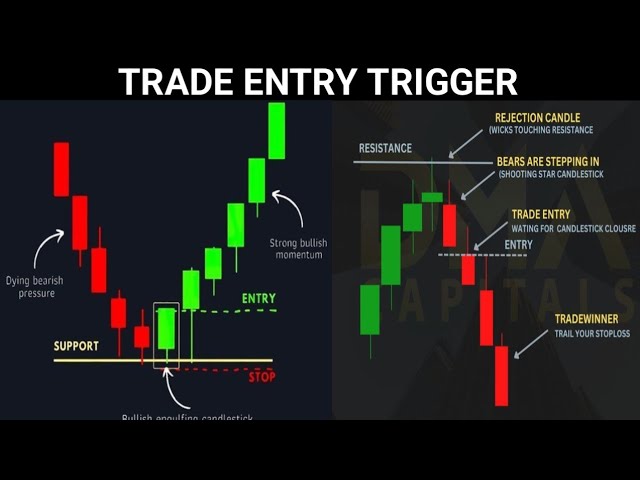
Once price reaches your zone and reacts, wait for a clear trigger.
Two popular price action triggers are:
Pin Bar: A candle with a pronounced wick showing rejection.
Engulfing Candle: A candle that strongly overwhelms the previous candle’s body and indicates a shift in short-term momentum.
For a bullish setup, a trader might wait for bullish rejection around support followed by a bullish trigger candle.
For a bearish setup, the opposite applies around resistance.
TradingView provides a wide range of drawing tools that can help you mark support and resistance zones, market structure, and important price areas directly on your chart.
Risk Management Matters
Place your stop-loss beyond the relevant swing structure rather than choosing an arbitrary number of points.
For example:
Entry: ₹500
Stop-loss: ₹490
Risk: ₹10 per share
Target: ₹520
Potential reward: ₹20 per share
That creates a 1:2 risk-to-reward ratio.
⚠️ A 1:2 setup does not guarantee profit. It simply means the potential reward is twice the amount being risked.
💡 Trader’s First-Hand Insight:
One of the biggest benefits of a structured price action setup is that invalidation becomes clearer. If a bullish trade depends on a particular swing low holding and price decisively breaks below it, the trader has a logical reason to exit instead of waiting for an indicator to turn bearish.
3. How to Practice Naked Price Action Charting on TradingView 📊
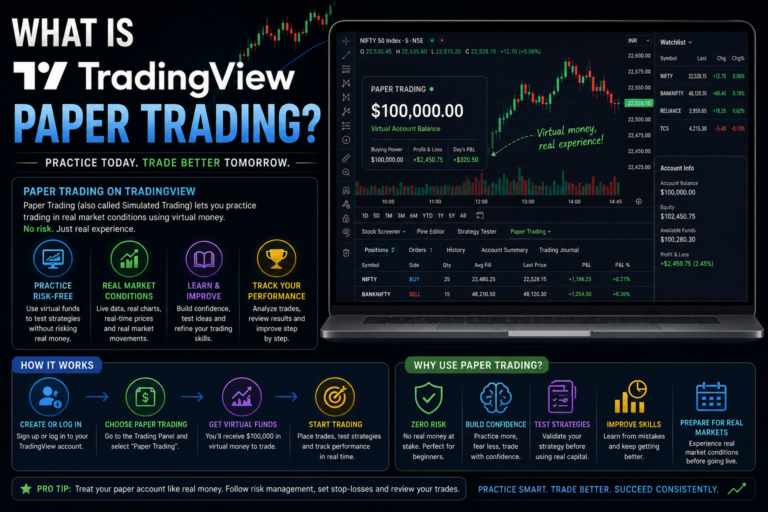
TradingView is useful for practicing price action tradingview analysis because you can replay historical markets, mark zones, and study structure without risking real money.
Practicing a price action trading strategy on historical TradingView charts can help beginners build confidence.
Clean Your Chart
Start by removing unnecessary indicators.
Your basic workspace can contain:
- Candlesticks
- Price scale
- Volume if you specifically use it
- Rectangle drawing tool
- Lines or paths for structure
- Your preferred timeframe
The goal is not to prove that indicators are useless. The goal is to learn how to read price independently.
f you’re new to chart analysis, TradingView’s technical analysis guide is a useful reference for understanding trend, support, resistance, price patterns, and chart intervals.
Use the Rectangle Tool
Use rectangles to mark support and resistance zones.
Instead of:
“Resistance is exactly 500.”
Think:
“Sellers have repeatedly reacted between 500 and 505.”
That small change can make your analysis more realistic.
Trading Psychology article7 Ways to Control Emotions While Trading
Map Market Structure
Use TradingView’s drawing tools to connect important swing points.
Mark:
HH → HL → HH → HL
or
LL → LH → LL → LH
Avoid marking every tiny candle movement. Focus on meaningful swings.
Practice Across Timeframes
Start with a higher timeframe to understand the broad structure, then move to a lower timeframe for execution.
For example:
Daily → 1-Hour → 15-Minute
The exact combination depends on your trading style.
💡 Trader’s First-Hand Insight:
A lower-timeframe bullish pattern can look attractive until the higher timeframe reveals that price is sitting directly under major resistance. Checking the broader structure first can stop a trader from taking a technically attractive but poorly located entry.
4. 3 Price Action Mistakes That Bleed Accounts ⚠️
Even a strong price action trading strategy can fail when risk management and trade execution are ignored.
Mistake 1: Drawing Too Many Support and Resistance Lines
If your chart resembles a spiderweb, you probably have too many levels.
📌 Focus on important zones, not every minor reaction.
A useful zone should have a reason behind it: repeated reactions, a major swing, breakout, or strong displacement.
Candlestick Patterns articleCandlestick Patterns Explained: 15+ Patterns Every Trader Should Know
💡 Trader’s First-Hand Insight:
When every minor high and low is marked, almost any candle can be interpreted as a signal. Reducing the chart to a few meaningful zones forces you to wait for higher-quality setups.
Mistake 2: Ignoring the Higher Timeframe
A five-minute bullish setup does not automatically mean the market is bullish.
The larger trend matters.
If the daily chart is strongly bearish and your lower timeframe shows a small bullish bounce, that bounce may simply be a temporary retracement.
Use higher-timeframe structure as your context and lower-timeframe price action as your execution tool.
💡 Trader’s First-Hand Insight:
Many failed intraday trades happen when traders focus only on the entry timeframe. A quick check of the higher timeframe can reveal whether the setup is moving with the dominant trend or directly against it.
Mistake 3: Entering Before the Candle Closes
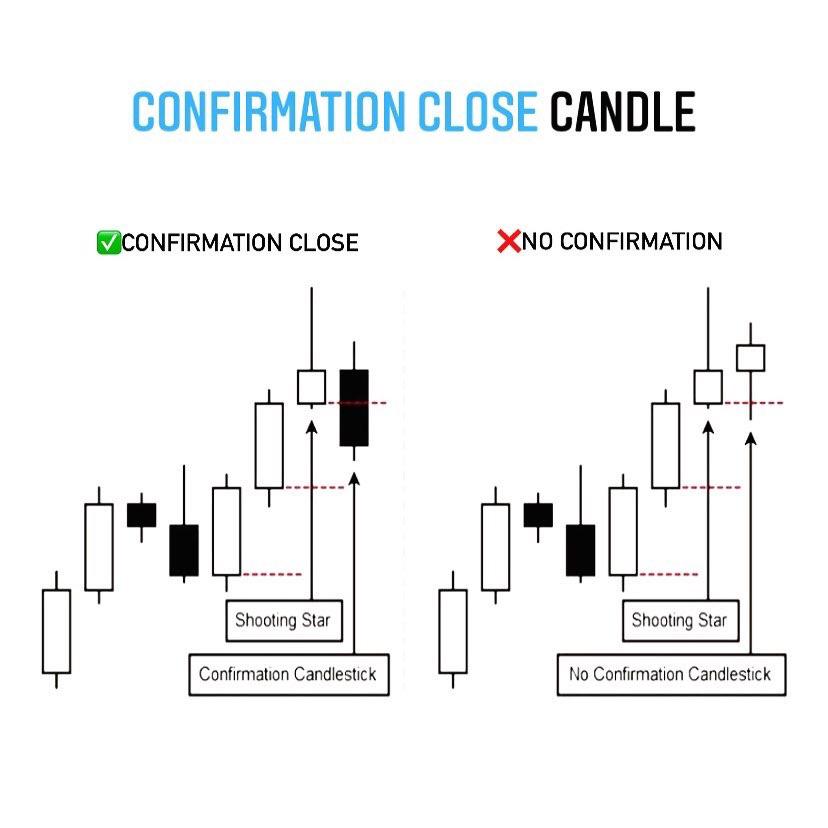
This is one of the easiest mistakes to make.
A candle may look like a perfect bullish engulfing candle with 20 seconds remaining. Then price reverses before the candle closes.
The setup was never confirmed.
📌 Wait for the candle close when your strategy requires candle confirmation.
You may enter slightly later, but you are making the decision using confirmed information instead of guessing.
💡 Trader’s First-Hand Insight:
A candle that looks bullish halfway through its formation can finish as a rejection candle. Waiting for the close removes much of that uncertainty and keeps the trading process consistent.
Build Your Own Price Action Trading Strategy Routine 🎯
A simple routine is more useful than constantly searching for another strategy.
Before entering a trade, ask:
- What is the higher-timeframe market structure?
- Where are the strongest support and resistance zones?
- Has price reached one of those zones?
- What reaction is price showing?
- Has my trigger candle closed?
- Where is my logical stop-loss?
- Is the potential reward worth the risk?
- Am I following my plan or forcing a trade?
If several answers are unclear, there may be no trade.
That is perfectly fine.
A professional approach is not about being in the market all the time. It is about being prepared when the right conditions appear.
💡 Trader’s First-Hand Insight:
Some of the best capital-preservation decisions are simply skipped trades. When structure is unclear, price is trapped between zones, or the risk-to-reward is poor, staying flat can be better than manufacturing a setup.
Start Reading the Chart, Not the Noise 📈
A strong price action trading strategy begins with simplicity: understand market structure, mark meaningful support and resistance zones, wait for price to react, and only then look for a confirmed entry. Clear your TradingView chart today and practice mapping HH, HL, LH, and LL on historical price data before risking real money. The more consistently you study raw price movement, the easier it becomes to recognize where buyers and sellers are actually making decisions.