Bollinger Bands Squeeze Strategy for Swing Trading: Beginner’s Guide
Introduction
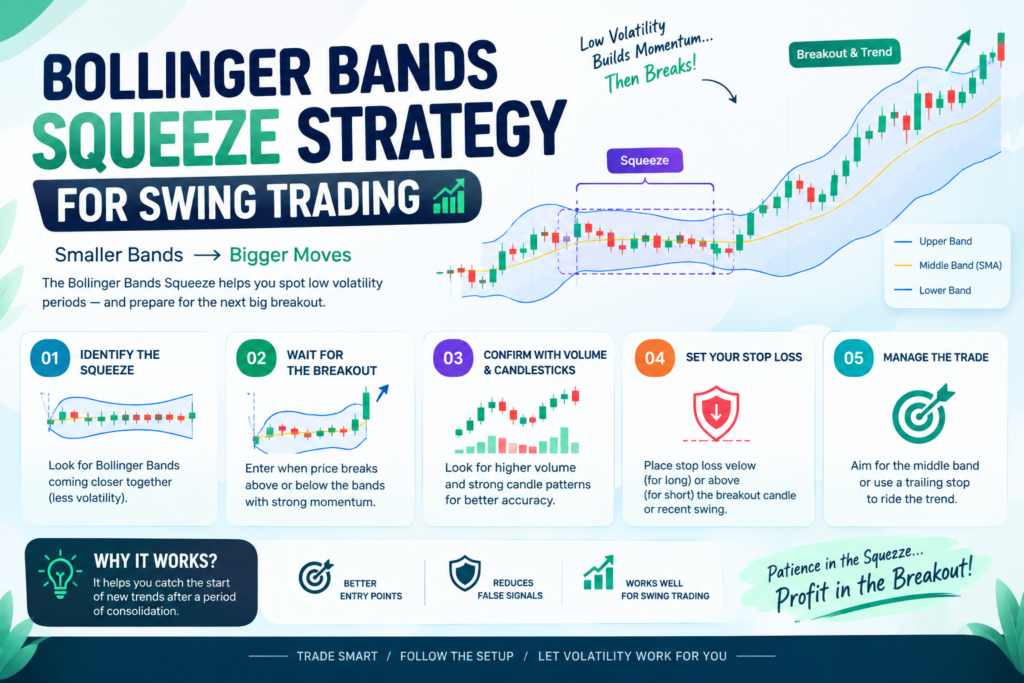
The Bollinger Bands Squeeze Strategy for Swing Trading is a simple way to identify periods when a market is becoming unusually quiet before a potential bigger move.
The idea sounds straightforward: Bollinger Bands become narrow, price gets compressed, and traders wait for a breakout. But here’s the thing — a squeeze doesn’t tell you whether price will go up or down. That’s where most beginners get confused.
I’ve seen traders spot a tight squeeze, immediately buy because they expect a huge move, and then watch price break in the opposite direction.
Not fun.
The better approach is to treat the squeeze as a setup, not an entry signal. You wait for price to break an important level, look for confirmation, and then manage the trade with a predefined stop-loss and target.
In this guide, I’ll show you how the strategy works, how to identify a good squeeze, where traders usually enter, what mistakes to avoid, and how you can test the setup yourself.
What Are Bollinger Bands? Let’s Keep It Simple
Bollinger Bands are a volatility indicator developed by John Bollinger.
The indicator normally has three lines:
- Middle Band: Usually a 20-period simple moving average.
- Upper Band: The middle band plus a volatility-based distance.
- Lower Band: The middle band minus a volatility-based distance.
The standard Bollinger Bands setup uses a 20-period moving average with the upper and lower bands typically placed two standard deviations away from it. You can see the calculation and settings in this Bollinger Bands indicator guide.
When price becomes more volatile, the bands generally move farther apart.
When volatility decreases, they move closer together.
That contraction is what traders call a Bollinger Band squeeze.
Here’s an easy way to think about it.
Imagine squeezing a spring.
The spring becomes compressed. You know energy is building, but you don’t know exactly which direction it will move once you let go.
A Bollinger squeeze is similar.
The market becomes compressed, volatility falls, and eventually price may make a stronger move.
But the indicator itself doesn’t predict the direction.
That’s why I wouldn’t buy simply because the bands have become narrow.
Bollinger Bands are a volatility indicator developed by John Bollinger. You can learn more about the indicator from the official Bollinger Bands resource.
Why Does the Bollinger Band Squeeze Matter for Swing Traders?
Swing traders are generally trying to capture larger price movements over several days or sometimes weeks.
A period of low volatility can be interesting because markets don’t remain quiet forever.
After consolidation, price may eventually expand into a stronger directional move.
For example, imagine a stock has been moving between ₹480 and ₹500 for several trading sessions.
During that period:
- The daily candles become smaller.
- Trading becomes less volatile.
- Bollinger Bands start contracting.
- Price repeatedly struggles near ₹500.
- Buyers continue defending the ₹480–₹485 area.
You now have a clear trading range.
Instead of randomly entering somewhere in the middle, you can wait for price to show which side of that range it wants to break.
That’s the real advantage of the squeeze.
It gives you a reason to become patient.
Traders who want to measure the distance between the upper and lower bands more precisely can also look at Bollinger BandWidth, which quantifies the width of the bands.
How the Bollinger Bands Squeeze Strategy Works
The basic process is:
Volatility contraction → consolidation → breakout → confirmation → entry → risk management
That’s it.
You don’t need ten indicators covering your screen.
Personally, I prefer keeping the chart relatively clean. When there are too many indicators, traders often end up looking for confirmation from the indicators instead of actually reading price.
The squeeze should give you the setup.
Price action should help give you the direction.
Risk management decides whether you can survive when you’re wrong.
Bollinger Bands can be combined with other forms of technical analysis rather than being treated as a standalone signal, which is why I prefer using price structure alongside the squeeze.
Step-by-Step Guide to the Bollinger Bands Squeeze Strategy for Swing Trading
Step 1: Start With the Daily Chart
For swing trading, the daily timeframe is a good starting point.
You can also experiment with the 4-hour chart if your strategy involves shorter holding periods, but don’t switch between timeframes randomly.
The higher timeframe generally gives you a clearer picture of the overall structure.
Before looking for a trade, ask:
Is the market trending or consolidating?
If the stock has been moving sideways for several days and the Bollinger Bands are contracting, that’s where the squeeze becomes interesting.
Step 2: Identify a Clear Bollinger Band Contraction
Look for a period where the upper and lower bands become noticeably closer together.
You’re looking for reduced volatility.
But don’t obsess over finding the absolute narrowest Bollinger Bands on the chart.
Instead, compare the current volatility with the recent market behavior.
If price used to make large daily moves and has now become compressed into a relatively small range, pay attention.
This is often where the setup begins.
Step 3: Find the Trading Range
Now forget the indicator for a moment and look directly at price.
Where are buyers stepping in?
Where are sellers stopping the price?
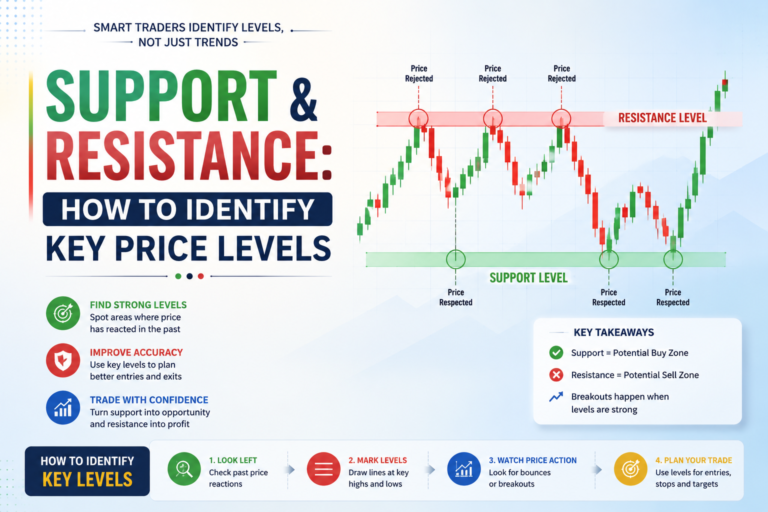
Mark the important support and resistance levels.
For example:
Resistance: ₹500
Support: ₹480
If price keeps bouncing between those levels while the Bollinger Bands contract, you have a much more useful setup than simply saying, “The bands are narrow.”
This distinction matters.
The squeeze tells you volatility is low.
The range tells you where the breakout needs to happen.
Step 4: Wait for the Breakout
This is where patience pays.
Suppose the stock has been stuck below ₹500 for several days.
Eventually, price moves above ₹500.
Don’t automatically jump into the trade just because one candle briefly crossed the level.
I’d rather see a convincing candle close above the resistance area.
Why?
Because price can temporarily move above resistance and then fall straight back into the range.
That’s a false breakout.
And yes, false breakouts can look incredibly convincing while they’re happening.
Step 5: Look for Confirmation
Once price breaks the range, look for additional evidence.
Possible confirmation can include:
- A strong breakout candle.
- Increased volume.
- A close above major resistance.
- The breakout moving in the direction of the broader trend.
- A successful retest of the breakout level.
You don’t need every confirmation.
For example, suppose ₹500 was strong resistance.
Price breaks ₹500 and closes at ₹512.
The next day, price falls back toward ₹500 but doesn’t break below it. Buyers step in and price starts moving higher again.
That’s a breakout-retest setup.
Some traders prefer this because they’re not buying the initial breakout blindly.
Of course, there’s a downside.
Sometimes price doesn’t retest anything. It just takes off.
You miss the trade.
That’s okay.
A missed trade is better than a forced trade.
Step 6: Plan Your Entry
There are two common approaches.
Immediate breakout entry: Enter after a confirmed candle closes beyond the important level.
Retest entry: Wait for price to return toward the broken level and confirm that the previous resistance is now acting as support.
Neither approach is automatically better.
The important thing is to decide your entry rules before you’re emotionally involved in the trade.
If you wait until price is already moving quickly, you’ll probably start making decisions based on fear of missing out.
That’s where mistakes happen.
Step 7: Place Your Stop-Loss Using Market Structure
Your stop-loss shouldn’t be based purely on an arbitrary percentage.
Instead, look at the structure of the trade.
For a bullish breakout, the stop might sit below:
- The recent swing low.
- The consolidation structure.
- The breakout level, depending on the setup.
- A meaningful support zone.
For a bearish breakout, the stop could sit above:
- The recent swing high.
- The consolidation range.
- A relevant resistance zone.
Here’s something beginners often get wrong.
They choose a position size first and then force the stop-loss into a location that doesn’t make technical sense.
Do the opposite.
Find the logical stop first. Then calculate your position size.
If the stop needs to be wider, reduce your position size.
Step 8: Set a Realistic Profit Target
Once you know your risk, decide where the trade could reasonably go.
Potential targets include:
- The next resistance level.
- The next support level.
- A previous swing high or low.
- A predefined risk-to-reward ratio.
For example, suppose you’re risking ₹1,000.
If your target is ₹2,000, you’re aiming for a 1:2 risk-to-reward ratio.
That doesn’t mean every trade needs to achieve exactly 1:2.
Market structure should still matter.
There’s no point choosing an unrealistic target simply because the calculator gives you a nice ratio.
Real-World Example: A Hypothetical Swing Trade
Let’s make this practical.
Suppose you’re watching a stock trading around ₹500.
For the last two weeks, the stock has repeatedly struggled around ₹510.
Every time it falls toward ₹485, buyers appear.
Meanwhile, the Bollinger Bands are becoming narrower.
You now have:
- Current price: ₹500
- Resistance: ₹510
- Support: ₹485
- Bollinger Bands: Contracting
- Market condition: Consolidation
You don’t buy yet.
You’re waiting.
A few sessions later, the stock breaks above ₹510 and closes at ₹516 with a strong bullish candle.
Let’s assume your planned entry is ₹516.
After looking at the chart structure, you determine that ₹498 is a logical stop.
Your risk is therefore:
₹516 − ₹498 = ₹18 per share
Now suppose you identify ₹552 as a realistic target.
Potential reward:
₹552 − ₹516 = ₹36 per share
That’s a theoretical 1:2 risk-to-reward ratio.
But here’s the important part.
The trade isn’t automatically good just because the numbers look nice.
You still need to monitor whether price can hold the breakout.
If the stock quickly falls below ₹510 and starts trading back inside the previous range, the bullish breakout becomes questionable.
This is why I don’t like strategies that say, “Buy when this indicator does X.”
Trading isn’t that mechanical.
Context matters.
What Makes a Squeeze Setup More Interesting?
Not every squeeze deserves your money.
Here are a few things I personally like to see.
1. The Squeeze Forms Near a Key Level
A squeeze directly below major resistance can be interesting.
Why?
Because price is becoming compressed while sitting near an area where sellers have previously appeared.
If buyers eventually push through that resistance, the breakout has a clear technical reference point.
2. The Broader Trend Supports the Setup
Suppose a stock has been making higher highs and higher lows.
Then it enters a tight consolidation.
The Bollinger Bands contract.
Eventually, price breaks upward.
That setup makes more sense to me than trying to predict a bullish breakout while the broader market is making lower highs and lower lows.
It’s not a guarantee.
It’s simply better context.
3. Volume Supports the Breakout
Volume can provide useful confirmation.
If a stock has been quiet for several days and suddenly breaks resistance with noticeably higher participation, that’s worth paying attention to.
But don’t treat volume as proof.
A high-volume breakout can still fail.
4. Price Closes Strongly Outside the Range
A quick spike above resistance isn’t the same thing as a strong close above resistance.
The candle itself gives you information.
If buyers push price above the range and price closes near the upper part of the candle, that’s generally more convincing than a candle that leaves a long upper wick and closes back inside the range.
If you want another way to measure where price sits relative to the bands, Bollinger Bands %b can provide a numerical view instead of relying only on visual inspection.
Common Mistakes to Avoid
Mistake #1: Entering Just Because the Bands Are Narrow
This is the classic beginner mistake.
A squeeze tells you volatility is contracting.
It doesn’t tell you whether the next move will be bullish or bearish.
Wait for the market to actually break something important.
Mistake #2: Treating Every Band Break as a Breakout
Price moving outside the upper Bollinger Band doesn’t automatically mean “buy.”
Price moving outside the lower band doesn’t automatically mean “sell.”
Always ask:
What level has actually been broken?
That’s much more useful than simply looking at the bands.
Mistake #3: Ignoring Support and Resistance
I’ve seen traders use Bollinger Bands while completely ignoring obvious price levels.
That’s backwards.
An indicator is much more useful when you understand where price has previously reacted.
Mistake #4: Using Too Many Indicators
Honestly, this is something I think most beginners eventually experience.
First you add Bollinger Bands.
Then RSI.
Then MACD.
Then stochastic.
Then three moving averages.
Suddenly the chart is covered with lines.
And somehow you’re even more confused.
You don’t need every indicator.
For this strategy, Bollinger Bands + price structure + basic volume analysis can already provide plenty of information.
Mistake #5: Risking Too Much Because the Setup Looks Perfect
There is no such thing as a guaranteed breakout.
Even the cleanest-looking squeeze can fail.
Don’t increase your risk because you feel unusually confident.
The market doesn’t care how good the chart looks to you.
When Should You Avoid a Bollinger Band Squeeze Trade?
Sometimes doing nothing is the better trade.
I’d be cautious when:
- The market is extremely choppy.
- Support and resistance aren’t clearly defined.
- The breakout has no meaningful follow-through.
- The stock has very low liquidity.
- Price repeatedly breaks levels and immediately reverses.
- The potential target is too close to justify the risk.
You don’t have to trade every squeeze you find.
That’s one of the hardest lessons for beginners.
A setup is only interesting when the entire trade makes sense.
Can You Combine Bollinger Bands With Moving Averages?
Yes.
A moving average can help you understand the broader trend while Bollinger Bands help identify volatility contraction.
For example, you could watch whether price is generally trading above or below a 20-period or 50-period moving average.
If price is above the moving average and the market forms a bullish squeeze near support, you may have a trend-aligned setup.
Again, don’t turn this into a complicated system.
The moving average should provide context, not make the entire trading decision for you.
How I Would Practice This Strategy
If you’re completely new to the strategy, don’t immediately start risking real money.
Open historical charts and find previous squeeze setups.
For every setup, record:
- Date.
- Stock or asset.
- Timeframe.
- Approximate squeeze duration.
- Support level.
- Resistance level.
- Breakout direction.
- Entry.
- Stop-loss.
- Target.
- Result.
- Screenshot of the setup.
After 30–50 examples, you’ll have something much more valuable than watching another ten trading videos.
You’ll have your own data.
You’ll start noticing patterns.
Maybe bullish breakouts work better when they’re aligned with the larger trend.
Maybe retest entries work better for you.
Maybe some types of consolidations produce too many false signals.
That’s how you turn a trading idea into a trading system.
Tools and Resources You Need
You don’t need expensive software to start learning this strategy.
TradingView
Useful for chart analysis, Bollinger Bands, support and resistance, moving averages and historical testing.
MetaTrader
Useful if you’re applying similar concepts to forex markets and want to monitor charts and execute trades.
A Trading Journal
Don’t underestimate this.
A simple spreadsheet is enough.
Track your setups, mistakes, wins, losses and screenshots.
After enough trades, the journal can tell you whether your strategy actually works or whether you’re remembering the winning trades and forgetting the bad ones.
A Simple Bollinger Band Squeeze Checklist
Before taking a trade, ask yourself:
- Are the Bollinger Bands clearly contracting?
- Is there a recognizable consolidation range?
- Where is the strongest support?
- Where is the strongest resistance?
- What is the broader market trend?
- Has price actually broken the important level?
- Did the breakout candle close beyond that level?
- Is volume supporting the move?
- Where is the logical stop-loss?
- Is the potential reward worth the risk?
If you can’t answer several of these questions, there’s no reason to rush.
The market isn’t going anywhere.
Frequently Asked Questions
Is the Bollinger Bands Squeeze Strategy good for swing trading?
Yes. It can be useful for identifying periods of low volatility that may eventually lead to a larger price movement. However, the squeeze itself doesn’t predict direction, so traders should wait for price confirmation.
What timeframe is best for Bollinger Band squeeze trading?
For swing trading, the daily timeframe is a sensible starting point. The 4-hour chart can also be tested for shorter swing setups.
What Bollinger Band settings should beginners use?
The standard 20-period and 2-standard-deviation settings are a reasonable starting point. You don’t need to constantly change them while learning the strategy.
Should I buy when price breaks the upper Bollinger Band?
Not automatically. A move above the upper band isn’t necessarily a valid breakout. Look for a break of meaningful resistance and preferably some confirmation that price can hold above the level.
Can Bollinger Band squeezes produce false breakouts?
Absolutely. False breakouts are one of the biggest problems with breakout strategies. That’s why support, resistance, candle closes, confirmation and proper risk management matter.
My Honest Take on the Bollinger Band Squeeze
I like this strategy because it encourages patience.
You’re not chasing a stock after it has already moved 8% or 10%.
You’re watching the market when volatility is contracting and waiting for a meaningful breakout.
But I wouldn’t use the squeeze as a standalone signal.
The phrase “Bollinger Bands are tight, so price is going to explode” sounds good on social media.
Real trading isn’t that simple.
A better way to think about it is:
Squeeze → identify the range → wait for breakout → confirm → manage risk.
That’s the process.
And sometimes the correct decision is to do absolutely nothing.
I’ve found that this mindset is useful not just for Bollinger Bands but for trading in general. You don’t get paid for being in the market every day. You get paid for managing good opportunities properly.
Final Thoughts
The Bollinger Bands Squeeze Strategy for Swing Trading can be a useful framework for finding potential breakout opportunities, especially when price has been consolidating for a while.
Start with the daily chart.
Use standard Bollinger Band settings.
Find the contraction.
Mark support and resistance.
Then wait.
Don’t predict the breakout before it happens. Let price prove the direction first.
And most importantly, decide your risk before entering the trade.
If you’re learning this strategy, spend some time studying historical charts and recording the setups you find. You’ll learn much more from analyzing 50 real examples than from memorizing another complicated indicator system.
If you found this guide useful, share it with another trader who is learning breakout strategies. You can also read our related trading guides to understand indicators, risk management and market structure in more detail.