How to Use Multi-Timeframe Analysis on TradingView to Catch Big Trends
If you take a buy trade on a 5-minute chart and price immediately runs into major resistance on the 1-hour chart, the problem may not be your entry. You may simply be looking at too little information.
Multi timeframe analysis TradingView helps solve this by making you check the bigger market structure before taking a lower-timeframe trade. Instead of treating every chart independently, you connect the Daily, 1-Hour, and 15-Minute charts to build one clear trading view.
📌 The basic idea is simple: higher timeframes give you direction, lower timeframes give you entries.
1. What Is Multi-Timeframe Analysis?
Multi timeframe analysis TradingView is the process of studying the same asset across several timeframes before entering a trade.
For example, you might analyze:
Daily → 1-Hour → 15-Minute
Each timeframe answers a different question:
- Daily: What is the overall market trend?
- 1-Hour: Where are the important support and resistance areas?
- 15-Minute: Is there a suitable entry setup?
This is also called top down chart analysis because you start with the bigger picture and gradually move toward your entry timeframe.
Imagine EUR/USD is rising strongly on the Daily chart. The 1-Hour chart shows higher highs and higher lows, but the 15-Minute chart temporarily pulls back.
A beginner might see the 15-minute decline and immediately sell.
An experienced trader asks a different question:
“Is this actually a reversal, or is it simply a pullback inside a larger uptrend?”
That difference can completely change your trade.
You can practice this process directly on TradingView by creating a multi-chart layout and comparing your higher and lower timeframes.
Why Higher Timeframes Matter
Markets contain multiple trends at the same time.
A stock can be:
- Bullish on the Daily chart
- Bearish on the 1-Hour chart
- Bullish again on the 5-Minute chart
None of these charts is necessarily wrong. They are showing different parts of the same market movement.
📈 The higher timeframe provides context.
📊 The middle timeframe provides structure.
🎯 The lower timeframe provides the trigger.
This is why multi timeframe analysis TradingView is particularly useful when you want to avoid taking trades against the dominant trend.
2. Step-by-Step Multi-Timeframe Analysis TradingView Setup
You don’t need ten indicators or complicated chart templates. A clean chart is usually enough.
Step 1: Start With the Daily Chart
Open your preferred market on TradingView and begin with the Daily timeframe.
Your first job is identifying the broad market structure.
Look for:
- Higher highs and higher lows
- Lower highs and lower lows
- Strong breakout areas
- Major support
- Major resistance
- Large consolidation zones
📌 Don’t worry about finding an exact entry yet.
You are simply answering:
“Would I prefer buying or selling this market right now?”
For example, if price is consistently creating higher highs and higher lows, your initial bias is bullish.
If price is creating lower highs and lower lows, your initial bias is bearish.
TradingView’s official documentation can help you understand how its chart layouts and multiple-chart features work before you build your own setup.
Step 2: Move to the 1-Hour Chart
Now move down to the 1-Hour timeframe.
This is where higher timeframe support resistance becomes extremely useful.
Mark important zones where price previously reacted strongly.
For example:
| Area | What to Look For |
|---|---|
| Support | Previous strong buying reaction |
| Resistance | Previous strong selling reaction |
| Breakout zone | Price broke through with momentum |
| Demand area | Buyers repeatedly entered |
| Supply area | Sellers repeatedly entered |
Suppose the Daily trend is bullish and the 1-Hour chart shows price pulling back toward an important support zone.
That is much more interesting than buying randomly in the middle of a move.
💡 You are now combining trend + location.
That is the real advantage of top down chart analysis.
Step 3: Move to the 15-Minute Chart
The 15-Minute chart is where you look for your actual trading setup.
You don’t automatically enter just because the Daily chart is bullish.
Wait for price to reach an area that makes sense.
Then look for confirmation such as:
- Break of a short-term structure
- Higher low
- Bullish candlestick pattern
- Strong rejection from support
- Momentum returning to the upside
For a short trade, simply reverse the logic.
📉 Daily bearish trend → 1-Hour resistance → 15-Minute bearish confirmation.
This creates a much more structured entry process.
3. The Three-Timeframe Rule Matrix
The exact timeframes depend on your trading style. There is no universal combination that works for everyone.
The following framework is a practical starting point:
| Trading Style | Higher Timeframe | Structure Timeframe | Entry Timeframe |
| Swing Trading | Weekly | Daily | 4-Hour |
| Day Trading | Daily | 1-Hour | 15-Minute |
| Scalping | 1-Hour | 15-Minute | 5-Minute |
| Fast Scalping | 15-Minute | 5-Minute | 1-Minute |
For swing traders, the Weekly chart provides the broader trend while the Daily and 4-Hour charts help identify entries.
For day traders, Daily → 1-Hour → 15-Minute is a useful combination.
For scalpers, 1-Hour → 15-Minute → 5-Minute can provide enough context without making the analysis unnecessarily slow.
⚠️ Avoid switching between random timeframes just because one chart looks more attractive.
Choose your three timeframes before the trading session and stick with them.
4. How to Align Trend Direction Before Entering
One of the biggest mistakes traders make is entering because the lower timeframe looks perfect.
Let’s say you’re watching XAU/USD.
The 1-Hour chart is clearly bearish. Price is making lower highs and lower lows.
Then the 5-Minute chart produces a temporary bullish breakout.
A trader sees the breakout and buys.
But the bigger trend hasn’t changed.
The 5-minute rally could simply be a retracement before sellers return.
This is where multi timeframe analysis TradingView becomes useful.
Instead of asking:
“Can I enter?”
Ask:
“Does this entry agree with the bigger market structure?”
That small change in thinking can prevent many low-quality trades.
A Simple Bullish Checklist

Before taking a long trade:
📈 Daily trend = bullish
📈 1-Hour structure = bullish or recovering from major support
📊 Price = near a meaningful support area
🎯 15-Minute = bullish confirmation
⚠️ Stop-loss = placed at a logical invalidation level
If several pieces disagree, there may be no trade.
And that’s completely fine.
No trade is better than a low-quality trade.
5. TradingView Multiple Charts: Why Split Layouts Help
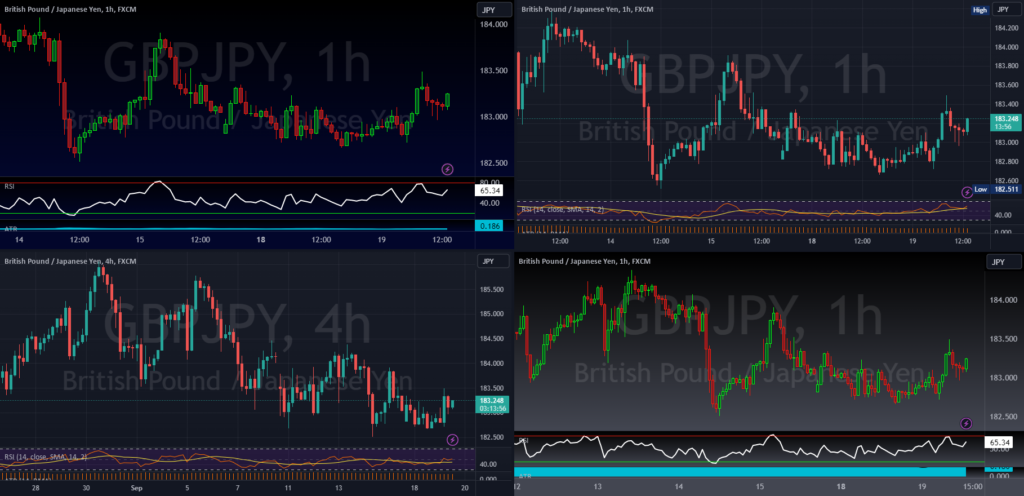
One of the most useful features for multi timeframe analysis TradingView is the ability to view multiple charts within the same layout.
Instead of repeatedly changing one chart from Daily to 1-Hour to 15-Minute, you can organize several charts together.
For example:
Chart 1: Daily
Chart 2: 1-Hour
Chart 3: 15-Minute
This is what traders mean when they talk about TradingView multiple charts or split-chart layouts.
[INSERT SCREENSHOT: TradingView multiple charts showing Daily, 1-Hour, and 15-Minute]
The benefit is not simply that it looks professional.
It reduces unnecessary clicking and lets you compare market structure quickly.
A Four-Chart Layout
For active traders, you could use:
| Chart | Purpose |
| Daily | Overall trend |
| 4-Hour | Major structure |
| 1-Hour | Support/resistance |
| 15-Minute | Entry setup |
📊 With this arrangement, you can see whether your lower-timeframe setup actually makes sense within the bigger picture.
However, don’t add charts just for the sake of adding charts.
If four charts create confusion, use three.
The goal of multi timeframe analysis TradingView is better decision-making, not more information.
6. How Pro Traders Use Split Layouts

Professional trading isn’t about predicting every market movement.
It’s about creating a repeatable process.
A split layout can help you follow that process consistently.
For example:
Daily: Identify the dominant trend.
↓
1-Hour: Find important price zones.
↓
15-Minute: Wait for confirmation.
↓
Execution: Enter only when the setup meets your rules.
This prevents the common mistake of opening a 1-minute chart and immediately searching for reasons to trade.
💡 Start with the market structure first. Search for an entry second.
This approach is particularly helpful during volatile sessions when price can move quickly.
You can also use a moving average indicator to help confirm whether the trend identified on the higher timeframe is strengthening or weakening.
7. Higher Timeframe Support Resistance Is Critical
A lower-timeframe setup can look perfect until you discover that price is approaching a major level from the higher timeframe.
Consider this example:
You see a bullish breakout on the 15-Minute chart.
You enter a buy.
But the Daily chart shows strong resistance only a short distance above your entry.
Price reaches that resistance, sellers enter, and your trade reverses.
The entry wasn’t necessarily bad.
The problem was location.
This is why higher timeframe support resistance should be marked before searching for lower-timeframe entries.
📌 Before entering, ask:
- Where is the nearest major support?
- Where is the nearest major resistance?
- Am I buying directly below resistance?
- Am I selling directly above support?
- Is there enough room for the trade to reach its target?
These questions can improve trade selection without adding another indicator.
If you want to strengthen your understanding of chart-based analysis, you can also review Investopedia’s educational material on technical analysis.
8. Common Multi-Timeframe Mistakes
Mistake 1: Using Too Many Timeframes
Looking at Weekly, Daily, 4-Hour, 1-Hour, 30-Minute, 15-Minute, 5-Minute, and 1-Minute charts can create analysis paralysis.
Use three primary timeframes.
Mistake 2: Ignoring the Higher-Timeframe Trend
A beautiful 5-minute setup isn’t automatically a good trade.
Always check the bigger picture.
Mistake 3: Treating Every Level as Important
Not every previous high or low deserves a line.
Focus on areas where price clearly reacted.
Mistake 4: Entering Before Confirmation
Reaching support doesn’t mean price must bounce.
Reaching resistance doesn’t mean price must fall.
Wait for evidence.
Mistake 5: Changing Your Bias After Every Candle
A single 15-minute candle should not completely change your Daily analysis.
Keep your analysis structured.
For additional confirmation, you can combine price structure with indicators such as the MACD indicator, rather than relying on an indicator alone.
9. A Practical Multi-Timeframe Trading Routine
You can make the entire process very simple.
Before Trading
📊 Open your three selected timeframes.
📈 Identify the dominant trend.
📌 Mark major support and resistance.
🎯 Decide whether you’re mainly looking for buys or sells.
During Trading
Wait for price to approach your marked zone.
Then move to the entry timeframe.
Look for your predefined confirmation.
Before Entering
Check:
- Trend
- Location
- Confirmation
- Stop-loss
- Risk-to-reward
- Position size
If one important condition is missing, wait.
⚠️ The goal isn’t to trade every movement. The goal is to trade the movements that fit your plan.
A clear multi-timeframe routine can also reduce emotional decisions, which is why trading psychology remains an important part of consistent execution.
10. Test the Layout Before Using Real Money

Don’t assume that multi timeframe analysis TradingView will automatically make you profitable.
It is a framework, not a trading system.
Your strategy still needs proper risk management, realistic expectations, and testing.
Open TradingView and use a paper-trading account or historical charts to test your approach.
Track at least:
- Setup type
- Higher-timeframe trend
- Entry timeframe
- Support/resistance location
- Stop-loss
- Target
- Result
- Mistakes
After 30–50 properly recorded setups, you’ll have much more useful information than you would get from judging the method after three trades.
Even when all three timeframes agree, proper risk management in trading should determine how much capital you put at risk on each position.
Final Thoughts
Multi timeframe analysis TradingView gives traders a practical way to connect the big picture with the actual entry. Use the higher timeframe for direction, the middle timeframe for structure and higher timeframe support resistance, and the lower timeframe for execution. Whether you use Daily → 1-Hour → 15-Minute for day trading or 1-Hour → 15-Minute → 5-Minute for scalping, keep the process consistent. 📈 Test the layout risk-free first, record your results, and let your data—not excitement—decide whether the approach belongs in your trading plan.