Top 3 Free TradingView Indicators for Scalping (With Exact Settings)
Introduction
TradingView indicators for scalping can help traders identify short-term trends, momentum changes, and potential entry points without overcrowding the chart.
TradingView indicators for scalping help traders identify trends, momentum shifts, and high-probability entry points in fast-moving markets. Scalping requires quick execution and a clean chart setup, so choosing the right indicators is important. In this guide, you will learn how to use three powerful TradingView indicators for scalping: the 5 EMA + 15 EMA crossover, RSI divergence, and VWAP with Bollinger Bands, including exact settings, entry rules, and stop-loss placement.
You can test these setups and customize the charts using TradingView before applying them to live markets.
Indicator #1: 5 EMA & 15 EMA Crossover
The 5 EMA and 15 EMA crossover is one of the simplest trend-following setups for scalpers. It helps identify short-term changes in momentum without putting too many indicators on the chart.
EMA stands for Exponential Moving Average. Unlike a simple moving average, an EMA gives more weight to recent price data, making it useful for short-term trading.
The 5 EMA and 15 EMA are simple TradingView indicators for scalping that can help traders identify short-term market direction.
If you want to understand how moving averages work before using this setup, read our complete guide to Moving Average Trading Strategy.
Exact TradingView Settings
Add two Exponential Moving Average indicators to your chart.
EMA 1
- Type: Exponential Moving Average
- Length: 5
- Source: Close
EMA 2
- Type: Exponential Moving Average
- Length: 15
- Source: Close
For scalping, you can test the setup on the 1-minute, 3-minute, or 5-minute chart. Beginners may find the 5-minute chart easier because it produces fewer random signals than a 1-minute chart.
When using TradingView indicators for scalping, wait for price confirmation instead of entering immediately after every crossover.
How the Buy Signal Works
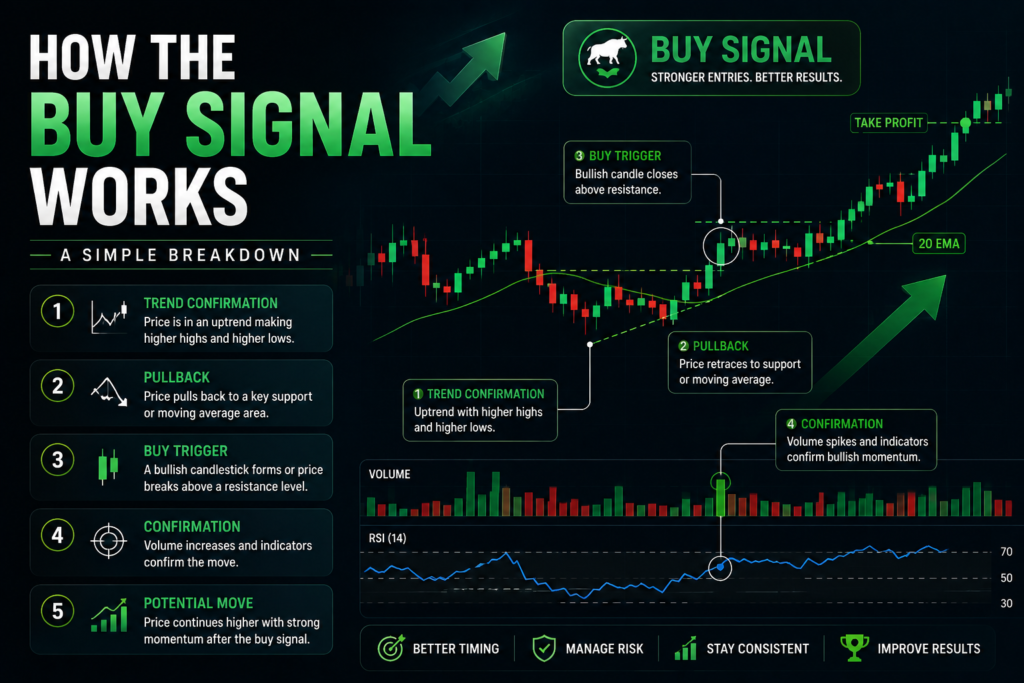
A basic bullish signal occurs when the 5 EMA crosses above the 15 EMA.
However, do not automatically buy every time the crossover happens. A crossover is a signal, not a guarantee.
Use this checklist:
- The 5 EMA crosses above the 15 EMA.
- Price is trading above both EMAs.
- The crossover candle closes above the EMAs.
- The market is showing higher highs or higher lows.
- Avoid entering if the crossover occurs directly into strong resistance.
A more conservative approach is to wait for the crossover and then look for a small pullback toward the EMAs.
For example, suppose XAUUSD is trading around $3,350. The 5 EMA crosses above the 15 EMA, and the next candle pulls back toward the moving averages without breaking the recent swing low. If buyers push price upward again, that can provide a cleaner entry than buying immediately at the crossover.
How the Sell Signal Works
The opposite setup is used for short trades.
Look for:
- The 5 EMA crosses below the 15 EMA.
- Price closes below both EMAs.
- The market is creating lower highs or lower lows.
- The crossover occurs away from major support.
- A pullback toward the EMAs fails and sellers return.
The pullback method can help reduce the risk of entering after price has already moved sharply.
Stop-Loss Placement
Avoid placing your stop-loss at an arbitrary number of points.
For a buy trade, one practical method is placing the stop below the most recent swing low.
For a sell trade, place the stop above the most recent swing high.
Another method is using a fixed percentage or volatility-based stop, but your stop should always fit the market and your position size.
Simple example
Suppose you enter a buy trade at 100.
- Entry: 100
- Recent swing low: 98.50
- Stop-loss: 98.40
- Risk: 1.60 points
Your position size should then be calculated according to how much money you are willing to lose if the stop is hit.
Do not increase your lot size simply because the setup looks strong.
Indicator #2: RSI Divergence Strategy
Before applying RSI divergence to scalping, learn how the indicator works and how traders interpret overbought and oversold conditions in our RSI Indicator Explained guide.
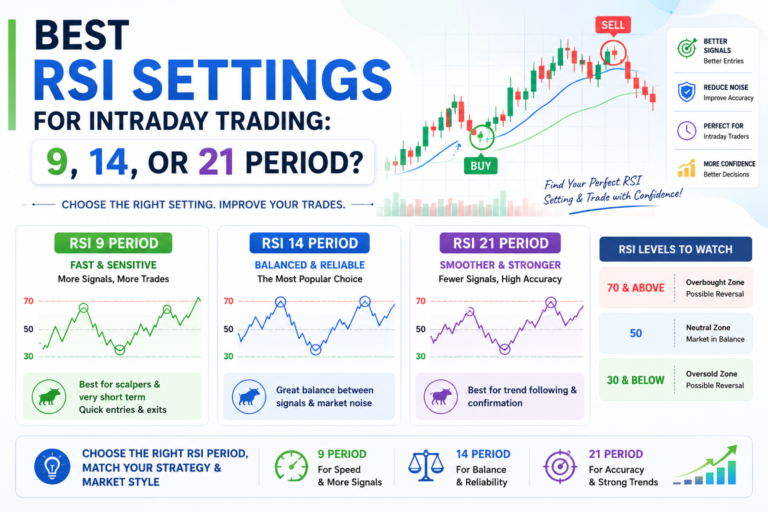
The Relative Strength Index (RSI) measures momentum and is commonly used to identify overbought and oversold conditions.
For scalping, RSI becomes more useful when you combine it with price action and divergence rather than treating an RSI level as an automatic buy or sell signal.
Exact RSI Settings
For the setup in this guide, use:
- Indicator: Relative Strength Index
- Length: 14
- Source: Close
- Chart timeframe: 5-minute
- Oversold level: 30
- Overbought level: 70
The 14-period RSI is a standard starting point and works well for testing divergence setups.
What Is Bullish RSI Divergence?
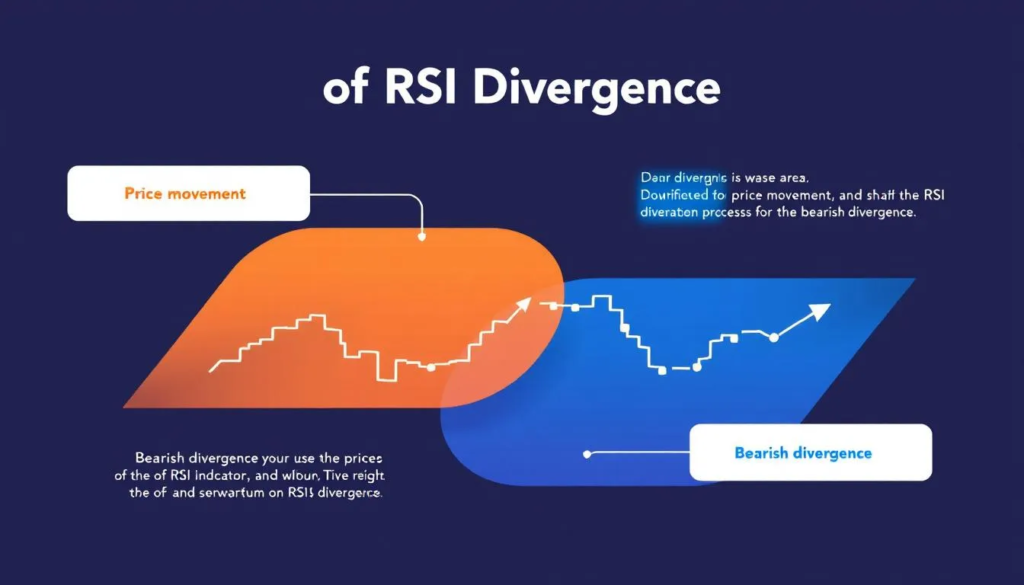
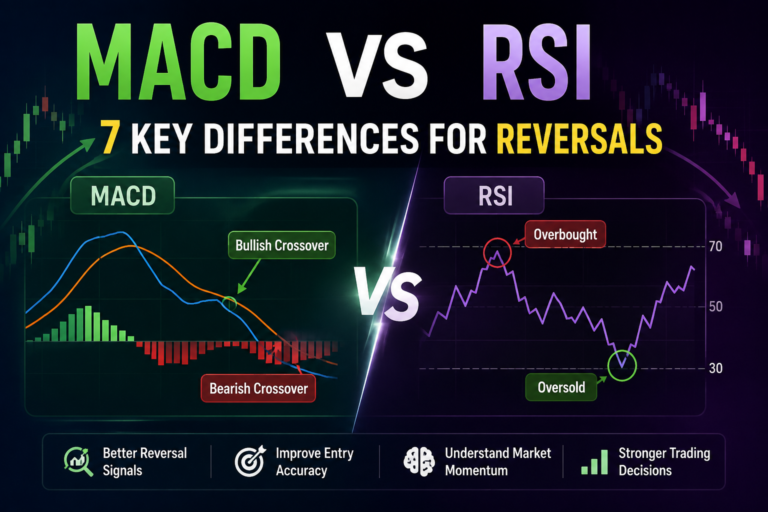
RSI divergence is another useful setup among TradingView indicators for scalping, especially when price approaches an important support or resistance level.
Bullish divergence happens when:
- Price makes a lower low
- RSI makes a higher low
This indicates that price has moved lower, but downside momentum has weakened.
That does not mean price must immediately reverse. Divergence is better treated as an early warning that momentum may be changing.
Identifying an Oversold Bounce
For a scalp buy setup, look for price to move into or near an oversold condition.
A simple sequence is:
- Price falls toward a previous support zone.
- RSI moves below or near 30.
- Price creates a new swing low.
- RSI creates a higher low instead of confirming the new price low.
- Price produces a bullish rejection candle.
- Enter after confirmation rather than buying simply because RSI is below 30
Example
Imagine an asset falls from 200 to 195.
RSI reaches 27.
Price then falls again to 194, creating a lower low. However, RSI rises to 31 and forms a higher low.
This is bullish divergence.
A trader could wait for price to reclaim a short-term resistance level or form a strong bullish candle before entering.
The key point is that oversold does not mean price must rise. A market can remain oversold while continuing to fall.
RSI Divergence Sell Setup
The reverse setup is bearish divergence:
- Price makes a higher high.
- RSI makes a lower high.
- Price approaches resistance.
- Momentum starts weakening.
- A bearish confirmation candle appears.
For scalping, bearish divergence can be especially useful when price makes a new high but struggles to continue.
Stop-Loss for RSI Divergence
For a bullish divergence trade, place the stop below the recent price swing low.
For bearish divergence, place the stop above the recent swing high.
The divergence becomes less useful if price completely breaks through the structure that created the setup.
A good rule is:
Do not move your stop farther away just to avoid taking a loss.
If the original setup is invalidated, exit according to your trading plan.
Indicator #3: VWAP + Bollinger Bands
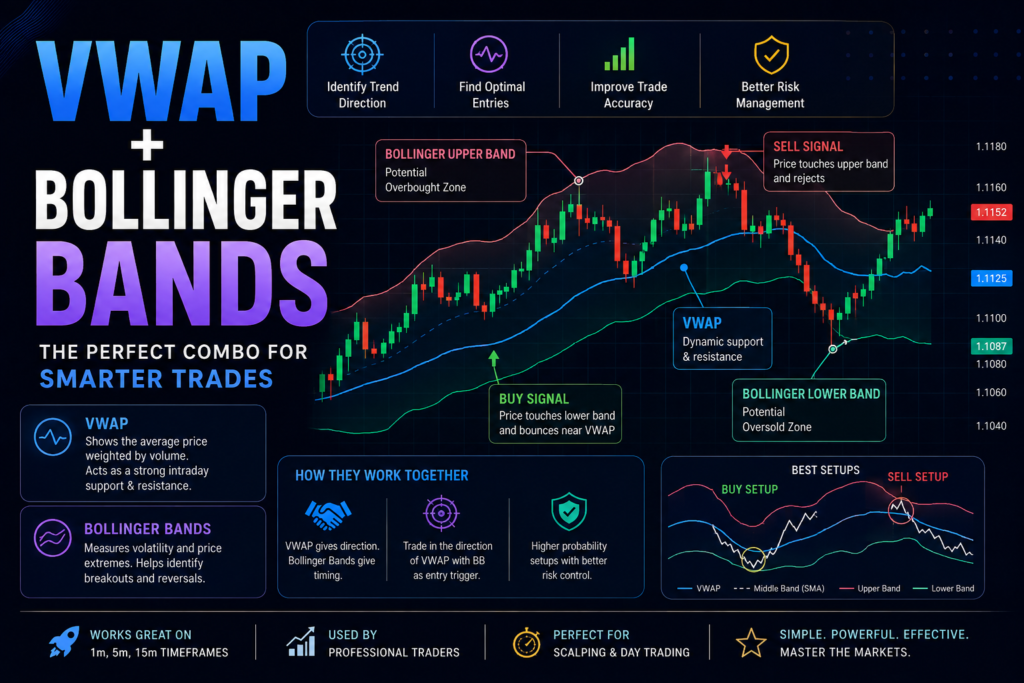
VWAP and Bollinger Bands can work together as TradingView indicators for scalping when traders are looking for potential mean-reversion opportunities.
The combination of VWAP and Bollinger Bands can help scalpers identify areas where price has moved significantly away from its average value.
VWAP stands for Volume Weighted Average Price. It calculates an average price while giving greater importance to areas where more volume has traded.
Bollinger Bands consist of a middle moving average and upper and lower bands based on price volatility.
This setup can be particularly useful around session boundaries, where liquidity and volatility can change.
Exact VWAP Settings
Add the VWAP indicator and use:
- VWAP: Session
- Source: HLC3 or the platform’s default VWAP source
- Bands: Optional
- Reset: Session
The important setting for this strategy is the session-based VWAP.
Exact Bollinger Bands Settings
![Bollinger Bands Setup]](https://blogwithvarun.com/wp-content/uploads/2026/08/f4d3195b-68eb-47e7-9883-c8c534882dfd-1024x683.png)
Use:
- Length: 20
- Moving average type: SMA
- Source: Close
- Standard deviation: 2
- Offset: 0
How the Mean-Reversion Setup Works
Mean reversion is based on the idea that after an unusually extended move, price may return toward an average area.
For this setup, VWAP acts as the central reference while Bollinger Bands help identify unusually extended short-term movement.
A potential long setup can occur when:
- Price reaches or moves below the lower Bollinger Band.
- Price is significantly below VWAP.
- The move occurs near an important session boundary or established support zone.
- Selling momentum starts weakening.
- Price moves back inside the Bollinger Bands.
- A bullish candle provides confirmation.
The initial target can be the middle Bollinger Band or VWAP, depending on the setup and market conditions.
Short Setup
For a potential short:
- Price reaches or moves above the upper Bollinger Band.
- Price is significantly above VWAP.
- The move occurs near resistance or a relevant session boundary.
- Buying momentum starts weakening.
- Price closes back inside the Bollinger Bands.
- A bearish candle confirms the move.
The middle Bollinger Band or VWAP can become a potential target.
Important Warning
Do not blindly sell the upper Bollinger Band or buy the lower Bollinger Band.
During a strong trend, price can remain near an outer Bollinger Band for an extended period.
For example, if XAUUSD is strongly bullish, price may repeatedly touch the upper band while continuing higher. Selling every touch can result in multiple losses.
Use market structure, VWAP location, support/resistance, and candle confirmation before taking the trade.
How to Combine These Tools Without Overcrowding Your Chart
Combining TradingView indicators for scalping can provide trend, momentum, and price-location information while keeping your analysis structured.
The biggest mistake beginners make is adding every indicator they find.
A scalping chart should answer three questions quickly:
1. What is the trend?
Use the 5 EMA + 15 EMA.
2. Is momentum weakening at an important price area?
Use RSI divergence.
3. Is price stretched away from its average?
Use VWAP + Bollinger Bands.
You do not necessarily need all three indicators on the screen at the same time.
A Cleaner Multi-Indicator Workflow
You can use the indicators in layers.
Step 1: Identify the Direction
Start with the 5 EMA and 15 EMA.
If the 5 EMA is above the 15 EMA and price is holding above both, your short-term bias can be bullish.
If the 5 EMA is below the 15 EMA and price is holding below both, your short-term bias can be bearish.
Step 2: Check Momentum
Use RSI to determine whether momentum is confirming the move or showing divergence.
For example, a bullish EMA structure combined with bullish RSI divergence near support can provide stronger context than an EMA crossover alone.
Step 3: Check Price Location
Use VWAP and Bollinger Bands to determine whether price is trading near its average or has become significantly extended.
This helps prevent chasing a move after a large candle.
Free vs Paid TradingView Accounts
TradingView provides charting and technical-analysis tools through its account plans, but the number of indicators and features available can depend on the plan you use and TradingView’s current pricing/features.
If you want to combine several indicators cleanly on one chart, a free TradingView account can be enough to start testing basic setups, while an upgraded plan can provide greater flexibility and additional charting features.
Do not upgrade simply because you are new to trading.
First learn the strategy, test it with historical charts, and use paper trading to collect results. Upgrade only if a specific TradingView feature genuinely improves your workflow.
One Simple Scalping Layout
If you want a clean starting layout, try:
Chart: 5-minute
Indicators:
- 5 EMA
- 15 EMA
- RSI 14
- Session VWAP
- Bollinger Bands 20, 2
Keep the chart visually simple. You can hide indicators when they are not needed rather than allowing five different tools to produce signals simultaneously.
Remember that indicators are calculated from price and volume data. They do not predict the future.
Your real edge comes from having clearly defined rules, controlled risk, consistent execution, and enough trades in your sample to determine whether the setup actually works for you.
Risk Management for These Scalping Strategies
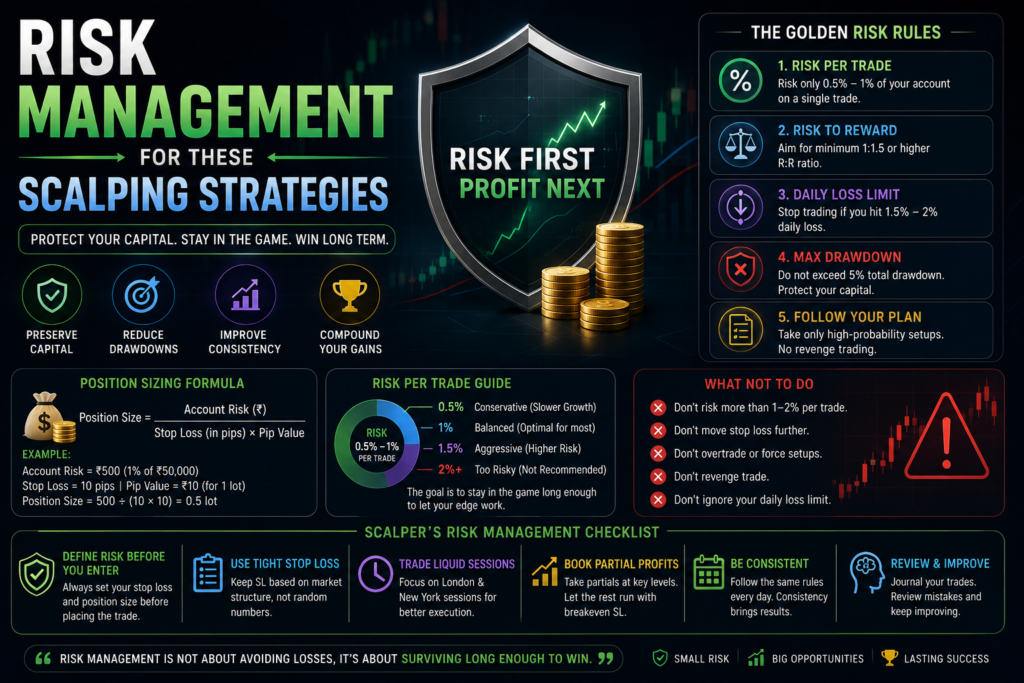
Before risking real money with any scalping setup, read our guide to Risk Management in Trading to learn how position size, stop-losses, and risk-reward ratios affect your results.
A good indicator setup cannot compensate for poor risk management.
Before taking any scalp, know:
- Your entry price
- Your stop-loss
- Your target
- The amount of money at risk
- Your maximum daily loss
- The conditions that invalidate the setup
Avoid risking a large percentage of your account on a single scalp.
Also avoid revenge trading after a losing trade. Scalping generates many opportunities, so there is usually no reason to force the next trade.
A strategy should be judged over a meaningful sample of trades rather than one winning or losing trade.
Record each trade in a journal and include the setup, entry, stop-loss, target, result, timeframe, and reason for taking the trade.
After 50 or more properly recorded trades, you will have much better information about whether the setup fits your trading style.
Because scalping involves frequent decisions, understanding Trading Psychology can help you control emotional mistakes and follow your trading plan consistently.
Final Thoughts
The 5 EMA + 15 EMA crossover, RSI divergence, and VWAP + Bollinger Bands are three practical indicator setups you can test for scalping. The EMA setup helps identify short-term direction, RSI divergence can highlight weakening momentum, and VWAP with Bollinger Bands can help identify extended price moves and potential mean-reversion areas.
No indicator guarantees profitable trades. Start with TradingView paper trading, test the exact settings above, record your results, and refine your rules only after collecting enough data. The goal is not to find an indicator that wins every trade—it is to build a repeatable process with controlled risk.