MACD vs RSI Indicator: 7 Key Differences for Reversals
MACD vs RSI Indicator: Which Is Better for Identifying Market Reversals?
Understanding the MACD vs RSI Indicator relationship can help traders separate early reversal warnings from stronger momentum confirmation.
When traders compare MACD vs RSI indicator for identifying market reversals, the better choice depends on market conditions and how the signal is interpreted. RSI is generally faster at identifying potentially exhausted moves through overbought, oversold, and divergence signals. MACD is slower but often provides stronger confirmation that momentum and trend direction are actually changing. For reversal trading, RSI is usually better for early warning, while MACD is better for confirmation. Using both together can reduce false reversal signals because RSI identifies potential exhaustion and MACD checks whether momentum is genuinely shifting.
RSI can provide an early warning of potential exhaustion, while MACD can help confirm a change in momentum; traders can learn more about how these indicators complement each other in this RSI and MACD indicators guide.
MACD vs RSI Indicator: Understanding RSI for Reversals
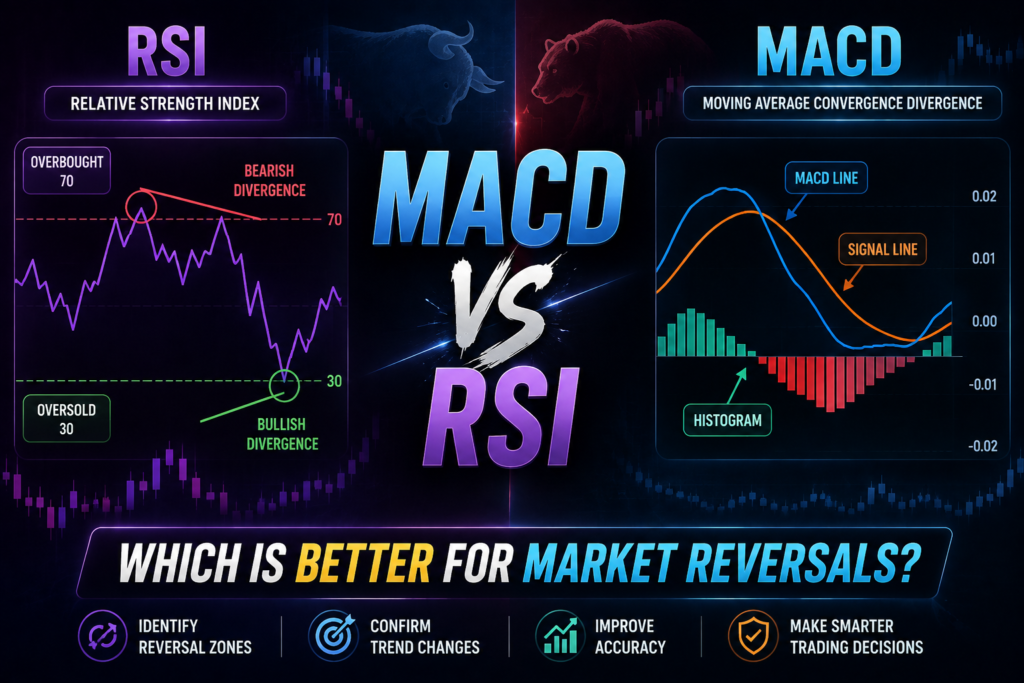
The Relative Strength Index (RSI) is a momentum oscillator developed by J. Welles Wilder. It measures the speed and magnitude of recent price changes on a scale from 0 to 100.
The standard RSI setting is 14 periods.
Before using RSI for market reversals, it is important to understand how the indicator measures momentum, overbought conditions, and oversold conditions .RSI Indicator Explained
How RSI Is Calculated
The basic RSI calculation uses average gains and average losses:
RS = Average Gain ÷ Average Loss
Then:
RSI = 100 − [100 ÷ (1 + RS)]
You normally do not need to calculate RSI manually because trading platforms perform the calculation automatically. However, understanding the formula explains why RSI reacts strongly when buying or selling pressure becomes extreme.
How RSI Identifies Reversals
The traditional RSI framework uses:
- Above 70: potentially overbought
- Below 30: potentially oversold
- Around 50: momentum balance or directional transition
Suppose gold rallies aggressively and RSI reaches 78. A beginner may immediately assume that the market must fall.
That is a mistake.
An overbought reading means momentum is strong, not that price must reverse immediately.
During a powerful uptrend, RSI can remain above 70 for an extended period while price continues making new highs.
The same applies to an oversold reading.
RSI Oversold and Overbought Traps
This is one of the biggest weaknesses of using RSI alone.
Imagine XAUUSD is in a strong downtrend. RSI falls below 30. You buy because the market appears oversold.
Price then continues falling.
In the MACD vs RSI Indicator debate, RSI has an important advantage because its fixed 0–100 scale makes extreme momentum conditions easy to identify.
Why?
Because oversold does not automatically mean reversal.
The market can remain oversold while institutional selling continues.
A better approach is to look for additional evidence:
- RSI divergence
- Support or resistance
- Break of market structure
- Candlestick reversal pattern
- Volume or momentum confirmation
- Higher-timeframe trend direction
RSI Divergence
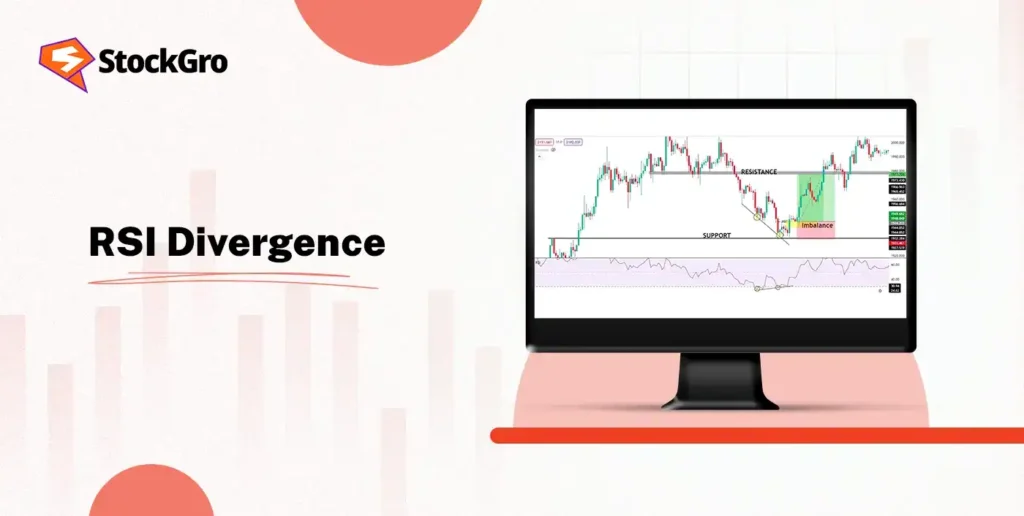
RSI divergence is particularly useful for reversal analysis.
This makes RSI particularly useful when comparing the MACD vs RSI Indicator approach for detecting early signs of market exhaustion.
Divergence can warn that momentum is weakening, but it does not guarantee an immediate reversal, so traders should combine it with price structure and confirmation signals. trading divergence
Bearish divergence occurs when:
- Price creates a higher high.
- RSI creates a lower high.
This suggests that price is rising while underlying momentum is weakening.
Bullish divergence occurs when:
- Price creates a lower low.
- RSI creates a higher low.
This indicates that selling momentum may be weakening.
However, divergence is not an automatic entry signal.
A market can remain divergent for several candles or even much longer before reversing.
That is why traders should treat divergence as an early warning signal, not a guaranteed prediction.
MACD vs RSI Indicator: Understanding MACD Confirmation
The Moving Average Convergence Divergence (MACD) indicator is designed to identify changes in momentum and trend direction.
Unlike RSI, which oscillates between 0 and 100, MACD is based on moving averages.
Because MACD is built from exponential moving averages, understanding how moving averages react to price can help traders better understand why MACD signals sometimes lag. Moving Average Explained: SMA vs EMA
If you are new to MACD, understanding its calculation, signal line, histogram, and crossover signals will make the reversal setups discussed here much easier to interpret. MACD Indicator Explained
The standard MACD settings are:
- Fast EMA: 12
- Slow EMA: 26
- Signal line: 9
The basic MACD formula is:
MACD Line = 12-period EMA − 26-period EMA
The signal line is a 9-period EMA of the MACD line.
The histogram represents the difference between the MACD line and signal line.
MACD Signal Line Crossovers
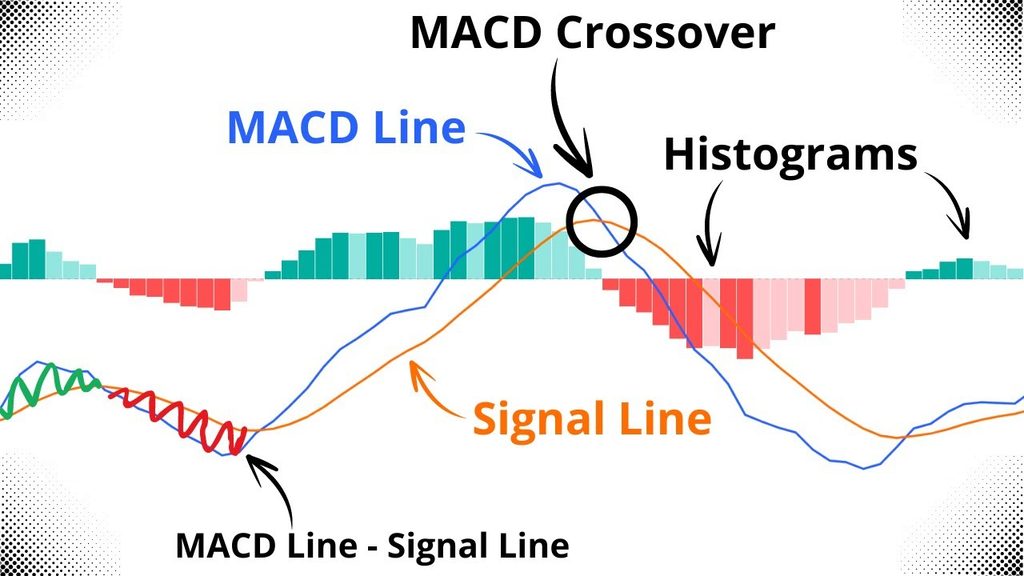
One of the most common reversal signals occurs when the MACD line crosses the signal line.
A bullish crossover happens when MACD moves above the signal line.
A bearish crossover happens when MACD moves below the signal line.
For example, after a prolonged decline, price begins stabilizing. MACD then crosses above the signal line.
This can indicate that bearish momentum is weakening and bullish momentum is beginning to increase.
However, the crossover is not necessarily the exact bottom.
MACD is derived from moving averages, so it naturally contains a degree of lag.
A MACD signal line crossover is commonly used to identify a potential shift in momentum, although traders should consider the broader market context before acting on the signal. MACD signal line crossover
MACD Histogram
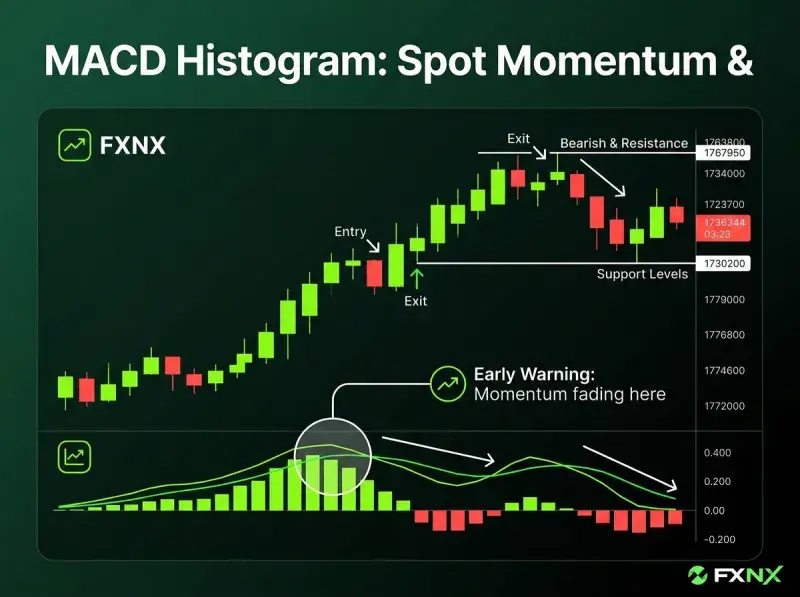
The MACD histogram can provide additional information about momentum.
When bullish histogram bars become larger, upward momentum is increasing.
When bullish bars begin shrinking, upward momentum may be losing strength.
The same principle applies to bearish momentum.
For example:
Large bearish bars → smaller bearish bars → bullish crossover
This sequence can suggest that sellers are losing control and buyers are gradually taking over.
The histogram therefore helps traders observe the transition in momentum, rather than simply looking at a crossover.
The Lag Problem
MACD’s biggest weakness for reversal traders is lag.
Because MACD uses exponential moving averages, price must already move before the indicator reacts significantly.
This means RSI may identify potential exhaustion before MACD confirms a directional change.
For a trader trying to catch the exact bottom or top, this can be frustrating.
However, the lag also has an advantage.
MACD often filters out some of the noise that causes premature RSI reversal signals.
Therefore:
The main difference in the MACD vs RSI Indicator comparison is that MACD generally waits for more price movement before confirming a potential reversal.
RSI tends to warn earlier. MACD tends to confirm later.
MACD vs RSI: Head-to-Head Comparison
The MACD vs RSI Indicator comparison becomes clearer when each tool is judged according to speed, market conditions, divergence, and confirmation strength.
| Factor | RSI | MACD |
|---|---|---|
| Primary purpose | Momentum and market exhaustion | Momentum and trend changes |
| Speed | Faster | Slower |
| Scale | 0–100 | No fixed range |
| Overbought/oversold | Yes | No |
| Signal line crossover | No | Yes |
| Histogram | No | Yes |
| Divergence | Useful | Useful |
| Trending markets | Can give premature reversal signals | Generally stronger for trend confirmation |
| Ranging markets | Often highly useful | Can produce frequent crossover noise |
| Reversal warning | Excellent | Moderate |
| Reversal confirmation | Moderate | Stronger |
| Main weakness | Overbought/oversold traps | Lag |
| Best use | Early reversal detection | Momentum/trend confirmation |
There is no universal winner.
The important question is what information you need from the market.
If you want to know whether price is becoming stretched, RSI provides that information quickly.
If you want to know whether momentum has actually shifted, MACD can provide better confirmation.
MACD vs RSI Indicator: Which Is Better for Market Reversals?
For early reversal detection, RSI generally has the advantage.
For confirmation of a developing reversal, MACD is often more useful.
Consider a simple example.
XAUUSD has been falling aggressively.
RSI reaches 25 and then forms bullish divergence. Price also reaches an important support zone.
At this stage, RSI is telling you:
Selling momentum may be weakening.
But you still do not know whether buyers can actually take control.
Then MACD begins showing:
- Smaller bearish histogram bars
- A bullish MACD crossover
- Increasing bullish momentum
Now the evidence becomes stronger.
The indicators are providing different information:
RSI: The move may be exhausted.
MACD: Momentum may actually be changing.
That distinction is extremely important.
MACD vs RSI Indicator: The Powerful Reversal Strategy
Instead of asking whether MACD or RSI is better, experienced traders can use both indicators for different purposes.
The goal is not to create more signals.
The goal is to filter weak signals.
A practical MACD vs RSI Indicator strategy does not require both indicators to generate identical signals; each indicator should perform a different job.
Step 1: Identify the Market Context
Before looking for a reversal, determine whether the market is:
- Trending upward
- Trending downward
- Ranging
- Consolidating
A reversal setup against a powerful trend requires much stronger evidence than a reversal inside a range.
For example, buying an oversold RSI during a strong bearish trend is dangerous.
First identify the broader market structure.
Step 2: Wait for RSI Exhaustion
Look for RSI to reach an extreme or form divergence.
For a potential bullish reversal:
- RSI moves below 30
- Price reaches major support
- Bullish RSI divergence appears
For a potential bearish reversal:
- RSI moves above 70
- Price reaches major resistance
- Bearish RSI divergence appears
This creates the reversal warning.
Do not enter automatically.
Step 3: Wait for MACD Confirmation
Now examine MACD.
For a bullish setup, look for:
- MACD bearish momentum weakening
- Histogram becoming less negative
- MACD line crossing above the signal line
For a bearish setup:
- Bullish momentum weakening
- Histogram becoming smaller
- MACD crossing below the signal line
The MACD confirmation should support the RSI signal.
Step 4: Confirm Price Action
Indicators should not operate in isolation.
Look for price-action confirmation such as:
- Break of a recent swing high or low
- Strong rejection candle
- Engulfing candle
- Breakout from consolidation
- Retest of broken support or resistance
For example, a bullish RSI divergence plus a MACD bullish crossover is interesting.
But if price is still making lower highs and lower lows, the reversal has not been proven.
A break of the most recent lower high provides stronger confirmation.
Step 5: Define Risk Before Entry
A technically attractive reversal setup can still fail.
Place the stop-loss at a logical invalidation point rather than choosing an arbitrary distance.
For a bullish reversal, that might be below the recent swing low.
For a bearish reversal, it may be above the recent swing high.
The position size should then be calculated according to the distance between entry and stop-loss.
This is particularly important when trading volatile instruments such as gold.
Example: Bullish Reversal Setup
Imagine XAUUSD has been falling toward a major support level.
The following sequence develops:
- Price reaches support.
- RSI falls to 27.
- Price makes a new low.
- RSI makes a higher low.
- Bullish divergence appears.
- MACD histogram becomes less negative.
- MACD crosses above the signal line.
- Price breaks the latest lower high.
- A retest holds above the broken structure.
This is considerably stronger than simply buying because RSI is below 30.
The setup contains three layers:
RSI = exhaustion
MACD = momentum confirmation
Price action = structural confirmation
That is the core idea behind combining MACD and RSI.
How to Avoid False Reversal Signals
Even the MACD + RSI combination cannot eliminate false signals completely.
Instead, traders should focus on improving the quality of setups.
Avoid Trading Directly Into Strong Trends
If price is strongly trending, RSI can remain overbought or oversold for a long time.
Do not assume that an extreme RSI reading means an immediate reversal.
Do Not Trade Every Divergence
Divergence shows a potential loss of momentum.
It does not guarantee that price will reverse.
Wait for confirmation.
Use Higher-Timeframe Context
A reversal on the 1-minute chart can simply be a temporary pullback on the 15-minute or 1-hour chart.
For scalpers, checking a higher timeframe can prevent many countertrend trades.
Do Not Enter Because Both Indicators Agree
MACD and RSI are both derived from price.
Their agreement does not make a trade risk-free.
The best setups combine indicator evidence with:
- Market structure
- Key levels
- Volatility
- Price action
- Risk management
Final Verdict: MACD or RSI?
The MACD vs RSI Indicator debate is therefore less about finding one perfect indicator and more about understanding when each tool provides the strongest information.
So, MACD vs RSI indicator — which is better for identifying market reversals?
The answer depends on the job you want the indicator to perform.
RSI is better for spotting potential exhaustion early.
MACD is better for confirming that momentum is shifting.
For traders specifically hunting reversals, RSI can provide the initial alert through oversold, overbought, and divergence conditions. MACD can then help determine whether that potential reversal is gaining momentum.
The strongest approach is therefore not choosing one indicator over the other.
Use RSI to identify the possibility of a reversal, MACD to confirm momentum, and price action to trigger the trade.
That three-step process is far more reliable than blindly buying every oversold reading or selling every overbought reading.
Financial Risk Disclaimer
For reversal traders, the MACD vs RSI Indicator combination can provide a structured way to evaluate exhaustion, momentum, and price confirmation.
Trading financial markets involves substantial risk and may result in the loss of capital. Technical indicators such as RSI and MACD are analytical tools, not guarantees of future price movements. Always use appropriate risk management, consider your financial situation and trading experience, and never risk money you cannot afford to lose. This article is for educational purposes only and does not constitute financial or investment advice.