Top 5 Bullish Candlestick Patterns for Day Trading (With TradingView Setup)
Introduction
Bullish candlestick patterns day trading setups become more reliable when traders combine price action with support, volume, and the broader market trend.
A common mistake among new traders is buying every hammer, bullish engulfing candle, or green candle they see. A candle can look bullish and still fail within the next few minutes if it forms in the wrong location.
The real edge comes from combining bullish candlestick patterns day trading setups with support zones, volume, trend direction, and disciplined risk management. In this guide, we’ll break down five useful bullish reversal patterns and show how to use TradingView’s built-in pattern detection to find them faster.
If you’re new to TradingView, learn how to use TradingView to set up charts, indicators, and alerts before applying these patterns.”
TradingView makes it easier to scan for bullish candlestick patterns day trading opportunities without manually checking every candle on multiple charts.
1. The Top 5 Bullish Reversal Patterns Explained 📈
Candlestick patterns are useful because they show the battle between buyers and sellers directly through price. But the pattern itself isn’t an entry signal.
A bullish candle at major support can be meaningful. The same candle in the middle of a strong downtrend can simply be a temporary bounce.
Learning the most useful bullish candlestick patterns day trading formations can help traders recognize potential reversal opportunities without relying on random green candles.
1. Bullish Engulfing Pattern 🟢
The bullish engulfing setup is one of the most closely watched bullish candlestick patterns day trading traders use around important support zones.
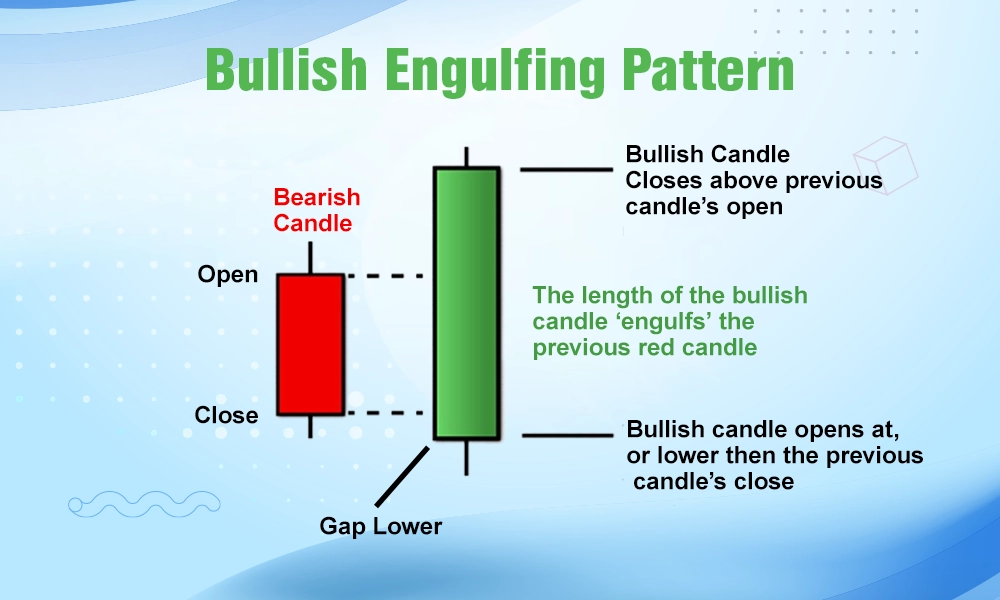
The bullish engulfing pattern consists of two candles.
The first candle is bearish, showing sellers are still controlling price. The second candle opens around or below the previous close and finishes strongly above the previous candle’s opening area, creating a body that engulfs the previous bearish body.
It shows a sharp change in short-term buying pressure.
What I look for:
- A clear preceding decline
- Pattern forming at support or demand
- Strong bullish closing candle
- Preferably increased volume
- Entry after confirmation rather than blindly buying the pattern
For example, if a stock falls toward a previous daily support zone and prints a bullish engulfing candle on the 15-minute chart, the setup becomes much more interesting than an identical pattern appearing randomly after a small pullback.
TradingView’s candlestick-pattern guide
TradingView tip: Search for automatic candlestick detection under Indicators → Technicals → Patterns.
💡 Trader’s First-Hand Insight: I never treat a bullish engulfing candle as permission to buy by itself. If the pattern forms directly underneath resistance, sellers can still absorb the buying pressure. A support zone gives the pattern a logical place to invalidate, which makes risk easier to control.
2. Hammer Candle 🔨
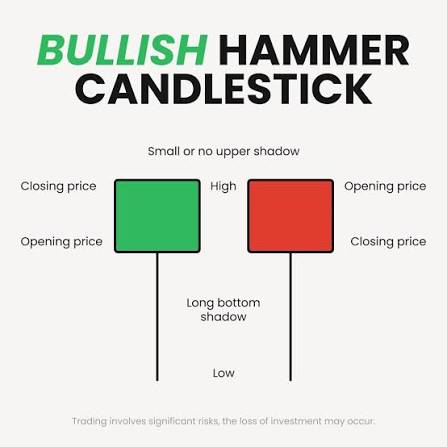
The hammer is a single-candle pattern characterized by a relatively small body and a long lower wick.
The long wick tells an important story: sellers pushed price lower, but buyers stepped in and forced price back toward the upper part of the candle.
The hammer becomes more useful when it appears after a decline and directly around a well-defined support level.
Basic setup:
- Price declines toward support.
- Sellers push price below the support area.
- Buyers reject those lower prices.
- The candle closes near its upper portion.
- The next candle confirms buying pressure.
Don’t confuse every long lower wick with a high-quality hammer. Context matters.
💡 Trader’s First-Hand Insight: A hammer floating in the middle of a chart doesn’t give me much confidence. At support, however, that lower wick can represent a failed attempt by sellers to break the level. That gives me a much clearer place to put a stop and protect capital.
3. Morning Star Candlestick Pattern 🌅
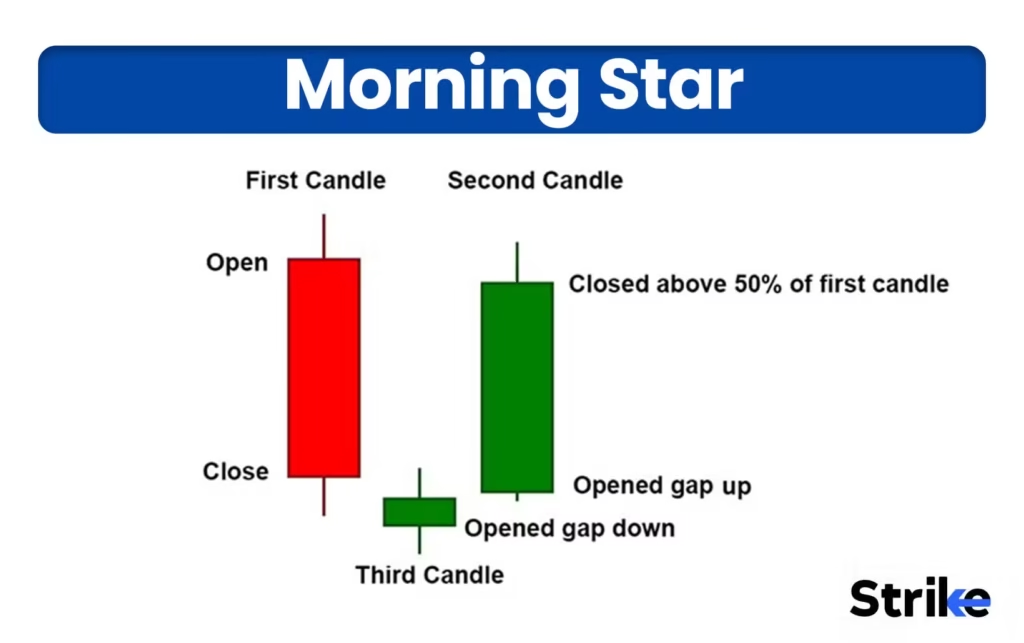
The morning star is a three-candle reversal formation.
Typically, the first candle is a strong bearish candle. The second candle has a relatively small body, showing that the aggressive selling pressure has weakened. The third candle is a strong bullish candle that pushes significantly into the body of the first candle.
It can signal a transition from bearish momentum toward potential bullish momentum.
Morning Star Candlestick Strategy
A practical morning star candlestick strategy can look like this:
- Identify a clear short-term downtrend.
- Mark important support.
- Wait for the first bearish candle.
- Look for the smaller middle candle showing hesitation.
- Wait for the third bullish candle.
- Consider entry only after bullish confirmation.
- Place the stop below the relevant pattern low.
- Target the next resistance zone.
The setup becomes stronger when the third candle is supported by increased volume.
💡 Trader’s First-Hand Insight: The morning star can look perfect and still fail if it appears away from support. I want the three-candle structure to develop where buyers have a reason to defend price. That combination is far more useful than simply memorizing the candle shapes.
4. Piercing Line 📊
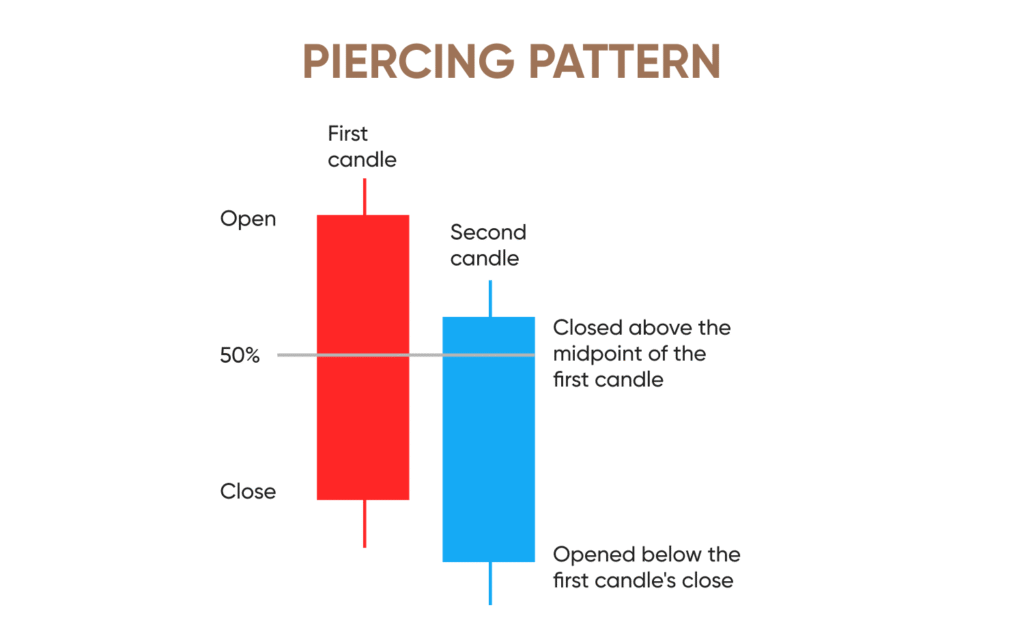
The piercing line is a two-candle bullish reversal pattern.
The first candle is bearish. The second candle opens weak but buyers take control and close the candle above the midpoint of the previous bearish candle’s body.
The deeper the second candle penetrates into the previous bearish body, the more convincing the buying response can appear.
Look for:
- A preceding decline
- Formation near support
- Strong bullish second candle
- Increasing volume
- Confirmation from the next candle
A piercing line isn’t automatically bullish just because the second candle is green. The location and closing position are what make the setup worth studying.
💡 Trader’s First-Hand Insight: One of the easiest ways to get trapped is to buy a piercing line directly beneath resistance. I first ask, “Where is price likely to meet sellers?” If the answer is only a few candles away, the reward may not justify the risk.
5. Bullish Harami 🟢
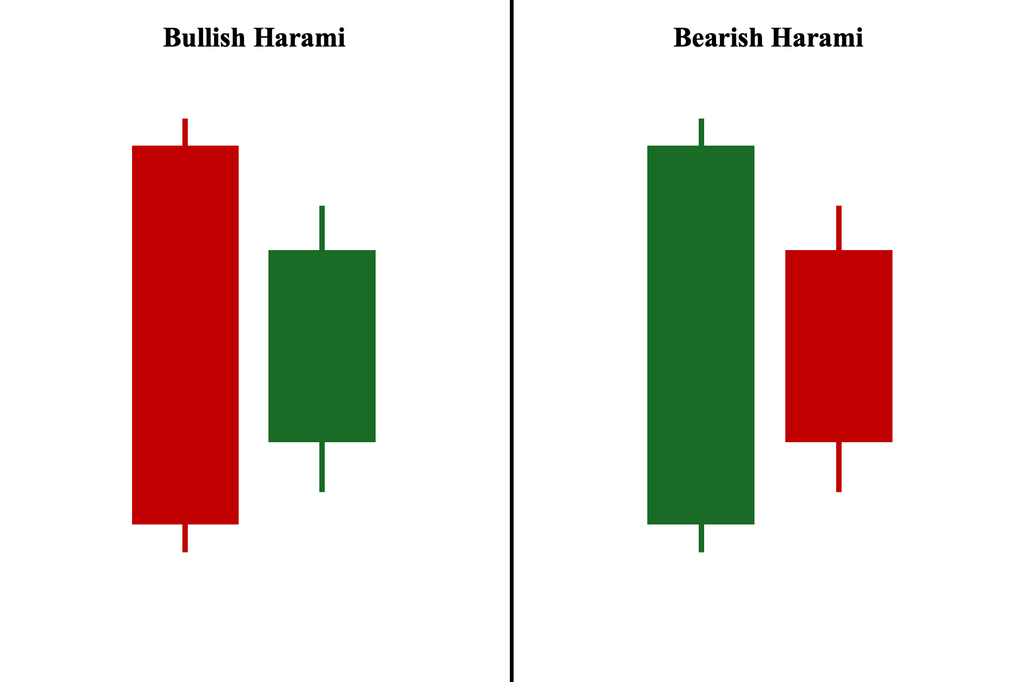
The bullish harami is a two-candle pattern where a smaller bullish candle forms inside the previous larger bearish candle’s body.
It can indicate that sellers are losing momentum.
Unlike a bullish engulfing pattern, which shows an aggressive shift toward buyers, a bullish harami is more about seller exhaustion and hesitation.
Because the pattern doesn’t necessarily show a powerful buying surge, confirmation becomes particularly important.
A simple approach is to wait for price to break above the high of the second candle or another nearby confirmation level.
💡 Trader’s First-Hand Insight: I treat the bullish harami as a warning that sellers may be running out of strength, not as proof that buyers have already taken control. Support plus confirmation is what turns that warning into a trade candidate.
These five bullish candlestick patterns day trading setups each tell a slightly different story about buyer and seller behavior.
📋 Bullish Candlestick Pattern Comparison
| Pattern | Candle Count | Main Signal | Reliability |
|---|---|---|---|
| Bullish Engulfing | 2 | Strong buyer takeover | High |
| Hammer | 1 | Rejection of lower prices | High |
| Morning Star | 3 | Bearish-to-bullish transition | High |
| Piercing Line | 2 | Buyers recover above 50% | Medium-High |
| Bullish Harami | 2 | Seller exhaustion | Medium |
Important: Reliability isn’t a fixed percentage. Market conditions, timeframe, liquidity, support/resistance, volume, and broader trend can completely change the outcome.
2. The 3-Rule Strategy for Trading Candlesticks Safely 🎯
Knowing five patterns isn’t enough. The real improvement comes from having a repeatable process.
Rule 1: Trade Patterns at Key Support
When using bullish candlestick patterns day trading strategies, the location of the pattern is often more important than the candle itself.
This is the most important rule.
Don’t buy a bullish pattern simply because it appears.
First mark:
- Previous swing lows
- Daily support
- Previous breakout levels
- Demand zones
- Important psychological price levels
- Major moving-average areas when relevant
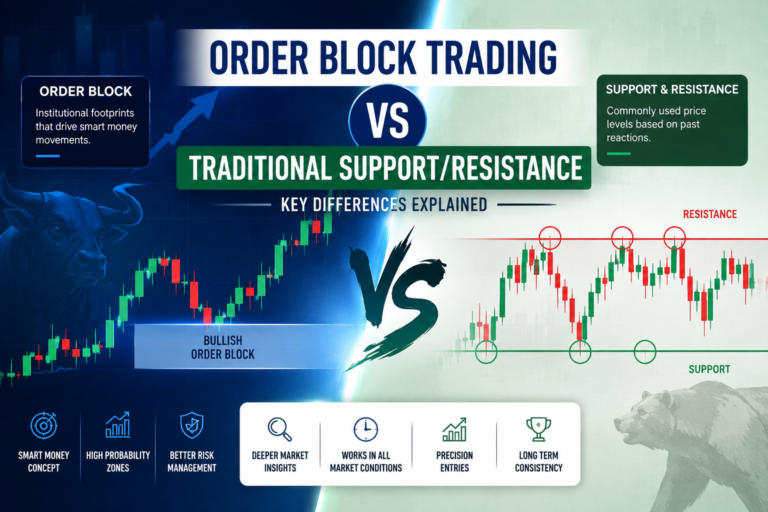
The strongest setups often occur when the candlestick pattern and support zone overlap.
Think of it this way:
Support = location
Candlestick pattern = trigger
Risk management = protection
Without the location, you’re often chasing.
💡 Trader’s First-Hand Insight: Most false breakouts happen because traders focus on the candle and ignore where that candle formed. A bullish pattern at support gives me a defined invalidation point. If price breaks that support decisively, I know the trade idea is wrong.
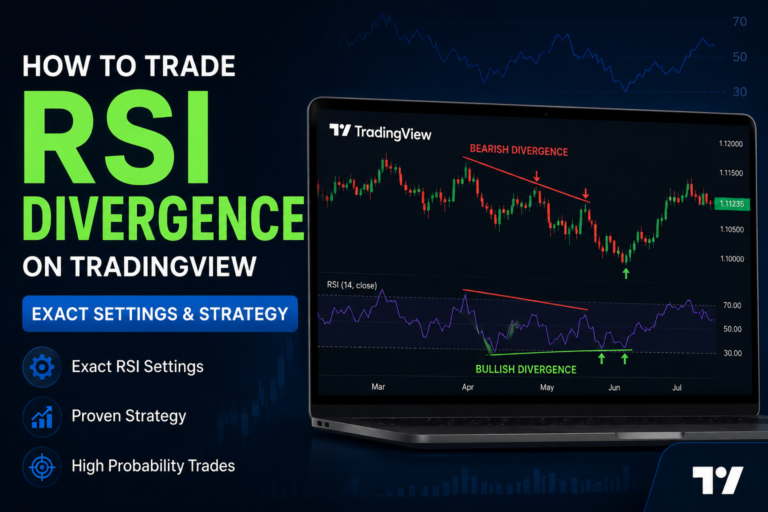
“For additional confirmation, traders can combine bullish candlestick patterns with the RSI indicator to identify potential oversold conditions near support.”
Rule 2: Confirm With Volume 📊
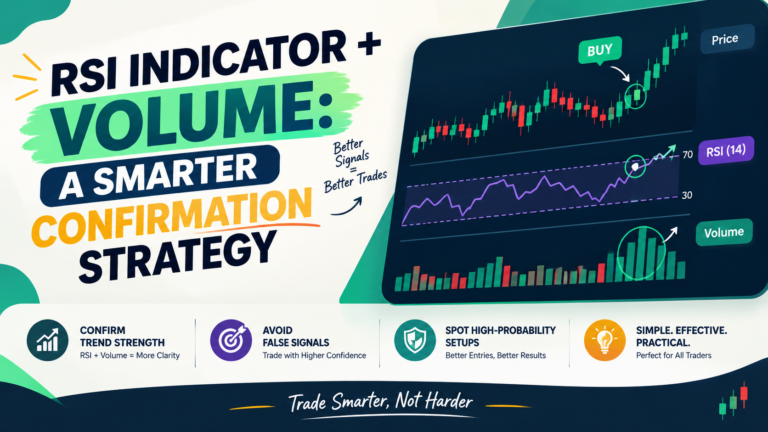
Volume can help you judge whether a move has participation behind it.
Suppose a bullish engulfing pattern forms with unusually strong volume after price tests support. That is more interesting than the same pattern forming on extremely low volume.
But volume isn’t a magic confirmation tool.
Look for a combination:
Support + bullish pattern + healthy volume + confirmation
rather than:
Bullish candle = buy
TradingView also notes that low volume can be associated with false breakouts in chart-pattern situations.
“The MACD indicator can provide another layer of momentum confirmation when a bullish reversal pattern appears.”
💡 Trader’s First-Hand Insight: I don’t need volume to explode on every trade, but I want to see evidence that buyers are actually participating. A beautiful candle with weak participation deserves more skepticism.
Rule 3: Use Precise Risk Management ⚠️
A good pattern can fail.
That’s normal.
The goal isn’t to eliminate losing trades. The goal is to make sure one losing trade doesn’t damage your account.
A basic framework is:
Entry: After pattern confirmation
Stop-loss: Below the relevant pattern low/wick or support invalidation point
Target: Next meaningful resistance
Minimum target: Aim for at least 1:2 risk-to-reward when the chart structure allows it.
For example:
If your stop represents ₹500 of risk, a 1:2 setup aims for approximately ₹1,000 of potential profit.
Never widen the stop simply because you don’t want to accept a loss.
“Before entering any setup, understanding the risk reward ratio in trading can help you decide whether the potential profit justifies the amount you’re risking.”
💡 Trader’s First-Hand Insight: The stop should be placed where the trading idea becomes invalid—not at a random distance from the entry. Support helps because it gives the trade a structural reason to fail.
3. How to Use TradingView’s Automatic Candlestick Pattern Detection 📱
TradingView can automatically identify candlestick patterns, which is useful when you’re scanning several markets.
The current TradingView process is:
Supercharts → Indicators, metrics, and strategies → Technicals → Patterns
TradingView’s official documentation says the available candlestick-pattern indicators can automatically detect patterns and display labels on the chart.
Step 1: Open TradingView
Open your preferred market in Supercharts.
Make sure your chart type is set to standard Candles.
TradingView’s current Supercharts documentation confirms that Candles can be selected from the chart-type menu.
Step 2: Open Indicators
Click:
Indicators, metrics, and strategies
Then select:
Technicals → Patterns
You should see the available pattern indicators.
Step 3: Add Candlestick Patterns
Select the appropriate candlestick-pattern indicator.
TradingView can display detected patterns directly on the chart using labels. Its documentation states that bullish indicators are displayed with blue labels, bearish indicators with red labels, while indicators capable of showing both directions can use gray labels.
[INSERT SCREENSHOT: TradingView Candlestick Pattern Indicator in Action]
Step 4: Don’t Buy Every Label
This is critical.
If TradingView identifies a bullish engulfing pattern, don’t immediately click buy.
Instead ask:
1. Is price at support?
2. What is the higher-timeframe trend?
3. Is volume supportive?
4. Where is resistance?
5. Where does my stop go?
6. Is there at least 1:2 potential reward-to-risk?
The indicator should save you scanning time—not replace your analysis.
💡 Trader’s First-Hand Insight: Automatic detection is useful for finding candidates, but the software doesn’t know your entire trading plan. A bullish pattern at a major resistance level can still be a terrible long trade. I use the indicator as a scanner, then manually inspect the chart structure.
Step 5: Create Pattern Alerts 🔔
TradingView’s candlestick-pattern indicators can work with its alert system. After adding the indicator, you can use the Create Alert function and select the indicator as the alert condition.
A practical workflow is:
Pattern detected → Alert received → Check support → Check trend → Check volume → Plan trade
That is much better than staring at charts all day waiting for one particular candle.
[INSERT TRADINGVIEW BUTTON HERE]
💡 Trader’s First-Hand Insight: Alerts should bring a chart to my attention, not force me into a trade. When an alert fires, I still want the pattern to pass my support, trend, volume, and risk checklist.
4. Three Common Pitfalls That Result in Fakeouts ⚠️
Mistake 1: Trading Tiny Timeframes
The 1-minute chart produces a huge amount of market noise.
You may see multiple hammers, engulfing candles, and other patterns within a short period.
That doesn’t mean there are multiple high-quality opportunities.
For many day traders, the 15-minute and 1-hour charts provide cleaner context, while lower timeframes can be used for execution after the larger setup is identified.
For example:
1-hour: Identify trend and major support.
15-minute: Find the reversal pattern.
5-minute: Refine entry if appropriate.
The exact timeframe combination should depend on your strategy and market.
💡 Trader’s First-Hand Insight: Lower timeframes can make almost every market move look like a pattern. I prefer getting the broader structure first and using the smaller chart only when I need a more precise entry.
Mistake 2: Entering Before the Candle Closes 🕯️
A candle that looks bullish halfway through its formation can finish bearish.
This is one of the most common problems with candlestick trading.
Imagine a potential bullish engulfing candle. Halfway through the candle, buyers push price aggressively higher. You enter immediately.
Then sellers return before the candle closes.
The final candle may no longer qualify as a bullish engulfing pattern.
Wait for confirmation.
This is particularly important when using automatic pattern indicators because the pattern’s validity depends on completed price data.
💡 Trader’s First-Hand Insight: An unfinished candle is still being negotiated by buyers and sellers. I don’t want to make a decision based on a candle that hasn’t finished telling me what happened.
Mistake 3: Ignoring the Macro Trend 📉
A bullish reversal pattern against a powerful higher-timeframe downtrend is fighting the larger market structure.
That doesn’t mean countertrend trades never work.
It means the probability and trade management can be different.
Before taking a bullish setup, check:
- Daily trend
- 4-hour trend
- 1-hour structure
- Recent swing highs and lows
- Major resistance
- Market momentum
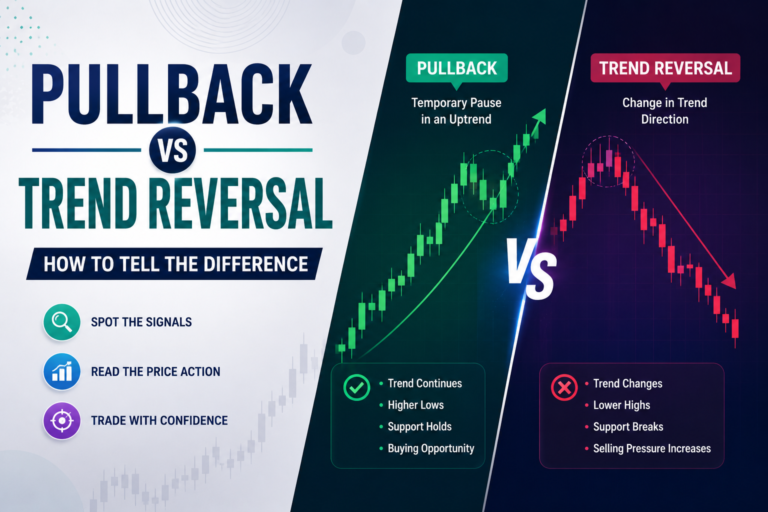
A bullish pattern inside a healthy uptrend pullback is usually a different situation from a bullish pattern attempting to reverse a major downtrend.
“A moving average trading strategy can also help identify whether a bullish candlestick setup is aligned with the broader market trend.”
💡 Trader’s First-Hand Insight: The candle is the trigger, but the trend provides the background. I would rather trade a bullish setup that aligns with the broader structure than constantly try to catch falling markets because a single hammer appeared.
How I Would Build a Simple Bullish Candlestick Setup 🎯
If you’re learning bullish candlestick patterns day trading, don’t try to trade all five patterns immediately.
Start with one repeatable setup.
For example:
Step 1: Identify an established uptrend or a controlled pullback.
Step 2: Mark a meaningful support zone.
Step 3: Wait for price to reach that zone.
Step 4: Look for a bullish engulfing, hammer, or morning star.
Step 5: Wait for the candle to close.
Step 6: Check volume and market structure.
Step 7: Define your stop before entering.
Step 8: Check whether the next resistance allows at least 1:2 risk-to-reward.
Step 9: Enter only if the complete setup makes sense.
Step 10: Record the trade and review it later.
This process is much more useful than collecting dozens of candlestick formations without a trading plan.
Quick Bullish Candlestick Checklist 📌
Use this checklist whenever you identify bullish candlestick patterns day trading signals on your chart.
Before entering a day trade, ask:
| Question | Yes/No |
| Is the pattern at meaningful support? | ☐ |
| Has the candle closed? | ☐ |
| Is the broader trend supportive? | ☐ |
| Is volume reasonable? | ☐ |
| Is resistance far enough away? | ☐ |
| Is the stop placed at structural invalidation? | ☐ |
| Is the potential reward at least 2× the risk? | ☐ |
| Am I entering because of a plan rather than FOMO? | ☐ |
If several answers are No, skipping the trade can be the better decision.
Final Thought 📈
Load TradingView, turn on its built-in candlestick pattern detection, and practice finding bullish engulfing, hammer, morning star, piercing line, and bullish harami setups on historical charts. Don’t judge the patterns by how attractive they look—judge them by their location, confirmation, trend, volume, and risk-to-reward structure. TradingView’s own guidance also stresses that patterns should complement broader analysis rather than be used as guarantees of future price movement.