How to Trade RSI Divergence on TradingView (Exact Settings & Strategy)
The RSI divergence strategy tradingview traders use works best when momentum, price structure, and confirmation are analyzed together.
If you have ever bought a stock just because the RSI dropped below 30, only to watch price fall another 3–5%, you already know the problem: oversold does not mean price must reverse. A better approach is to study what price is doing compared with RSI. That is where the RSI divergence strategy TradingView traders use can become useful. Divergence can highlight a potential loss of momentum before a reversal becomes obvious on the chart. However, it is a setup—not a guaranteed signal. The key is combining divergence with support, price action, volume, and sensible risk management.
The RSI divergence strategy tradingview traders use can help identify weakening momentum before a potential reversal becomes obvious.
📈 What Is RSI Divergence?
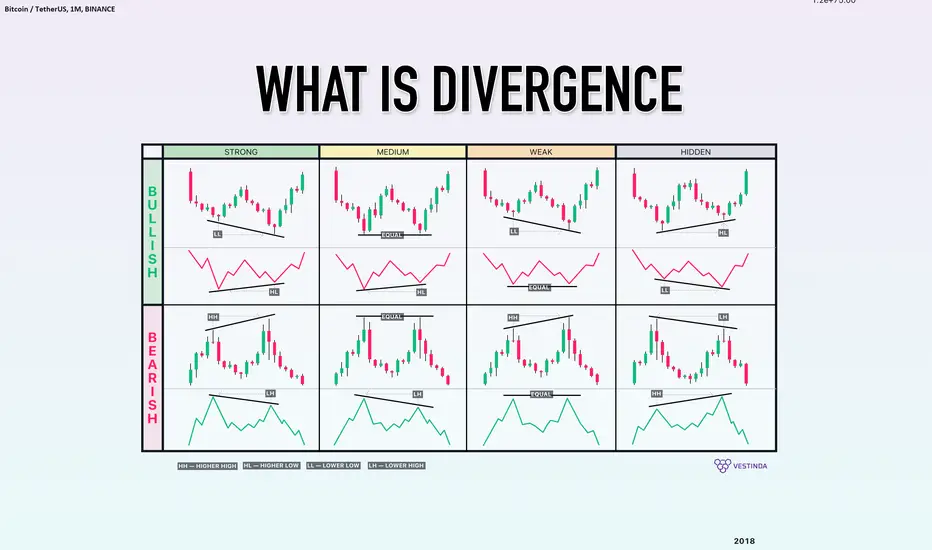
RSI divergence occurs when price and the Relative Strength Index move in different directions.
Think of it this way: price tells you what the market is doing, while RSI helps you judge the momentum behind that move.
When price reaches a new extreme but RSI fails to confirm it, momentum may be weakening.
There are two major types of regular divergence:
The RSI divergence strategy tradingview approach becomes more useful when divergence appears near important support or resistance.
Bullish RSI Divergence
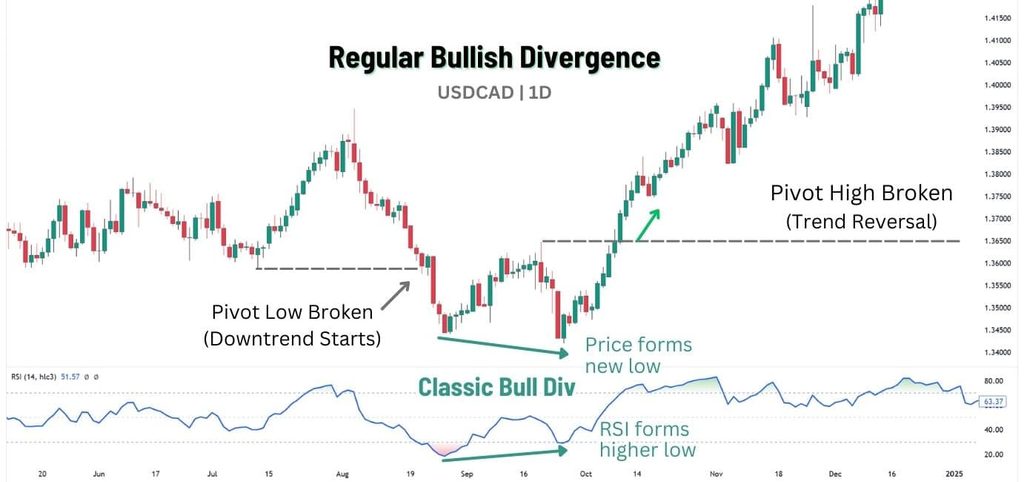
A disciplined RSI divergence strategy tradingview setup should always define the entry, stop loss, and profit target before the trade is opened.
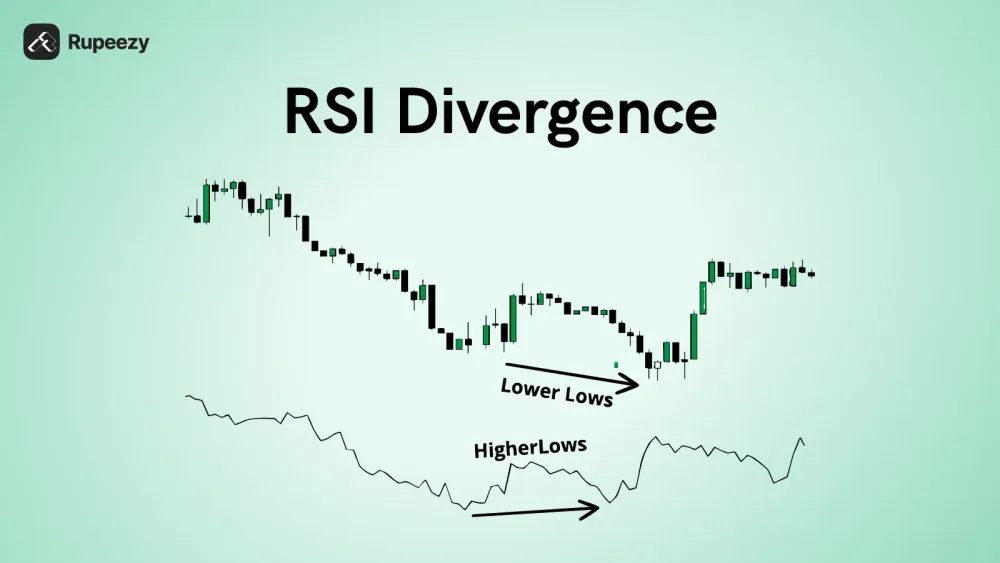
A bullish RSI divergence forms when:
- Price creates a lower low.
- RSI creates a higher low.
- Selling momentum is weakening.
- A bullish reversal may follow.
For example, imagine Nifty 50 falls from 24,800 to 24,500. Later, it drops again to 24,350, making a fresh low. But RSI makes a higher low compared with its previous reading.
That difference is the divergence.
It does not mean you should immediately buy. Instead, it tells you to start watching for a reversal confirmation.
Bearish RSI Divergence

Bearish divergence is the opposite:
- Price creates a higher high.
- RSI creates a lower high.
- Buying momentum is weakening.
- A potential bearish reversal may develop.
This can be particularly useful when price reaches an important resistance level after a strong rally.
Regular vs Hidden Divergence
Hidden divergence is slightly different. Instead of identifying a possible major reversal, it can help identify trend continuation.
| Setup | Price Action | RSI Action | Typical Signal |
|---|---|---|---|
| Bullish Regular | Lower low | Higher low | Potential bullish reversal |
| Bearish Regular | Higher high | Lower high | Potential bearish reversal |
| Bullish Hidden | Higher low | Lower low | Potential uptrend continuation |
| Bearish Hidden | Lower high | Higher high | Potential downtrend continuation |
📌 Simple rule: Regular divergence often warns of a possible reversal, while hidden divergence can support the idea that the existing trend may continue.
💡 Trader’s First-Hand Insight
One common mistake is spotting bullish divergence on a falling stock and assuming the bottom is confirmed.
Imagine a stock drops from ₹800 to ₹720. RSI forms bullish divergence, but the broader market is also selling heavily. Price breaks ₹720, triggers stop losses, and falls toward ₹680 before eventually recovering.
The divergence was real—but the entry timing was poor.
I would rather wait for price to reclaim a nearby resistance level or print a strong bullish reversal candle than buy simply because RSI has diverged.
⚙️ The Best TradingView RSI Indicator Settings
You do not need five indicators and a screen full of lines to trade RSI divergence.
For most beginners and intermediate traders, the standard 14-period RSI is a strong starting point.
These settings provide a simple foundation for an RSI divergence strategy tradingview setup without adding unnecessary indicators.
TradingView’s official RSI guide explains how the indicator measures momentum and confirms that 14 periods is the standard default setting for RSI.
Recommended RSI Settings
| Setting | Recommended Value |
| RSI Length | 14 |
| Source | Close |
| Upper Level | 70 |
| Lower Level | 30 |
| RSI-Based MA | On for smoothing/filtering |
| Timeframe | Match your trading setup |
To configure it on TradingView:
TradingView also provides an official RSI strategy reference showing how RSI-based rules can be structured around overbought and oversold levels
- Open your desired stock, index, or currency chart.
- Click Indicators.
- Search for Relative Strength Index (RSI).
- Add the RSI indicator.
- Open its settings.
- Set Length to 14.
- Keep the source as Close.
- Use 70 and 30 as your standard overbought and oversold reference levels.
- Turn on the RSI-based moving average if you want additional momentum smoothing.
Why Use RSI 14?
The default 14-period setting gives you a reasonable balance between responsiveness and noise.
A very short RSI can react quickly, but on a 1-minute or 5-minute chart it can produce numerous weak signals.
A very long RSI can become smoother, but you may identify divergence too late.
For day trading, RSI 14 is therefore a practical baseline. Once you have enough backtested data, you can test other settings according to your specific market and timeframe.
⚠️ Don’t Optimize the RSI Just to Fit Historical Trades
This is where many new traders go wrong.
They test RSI 7, then RSI 9, RSI 12, RSI 14, RSI 18, and eventually choose whichever produced the best historical result.
That can create a strategy that looks excellent in hindsight but performs poorly in live markets.
Use standard settings first. Build consistency before changing parameters.
💡 Trader’s First-Hand Insight
Suppose you are trading a highly volatile stock on a 5-minute chart. RSI 7 may jump from 25 to 55 very quickly and produce several apparent divergences during the session.
Instead of reacting to every signal, I would first mark the major support and resistance zones. If divergence occurs directly at daily support and price prints a bullish rejection candle, the setup becomes much more interesting.
The location of divergence often matters more than squeezing another few points of accuracy from the RSI settings.
🎯 The 3-Step RSI Divergence Execution Strategy
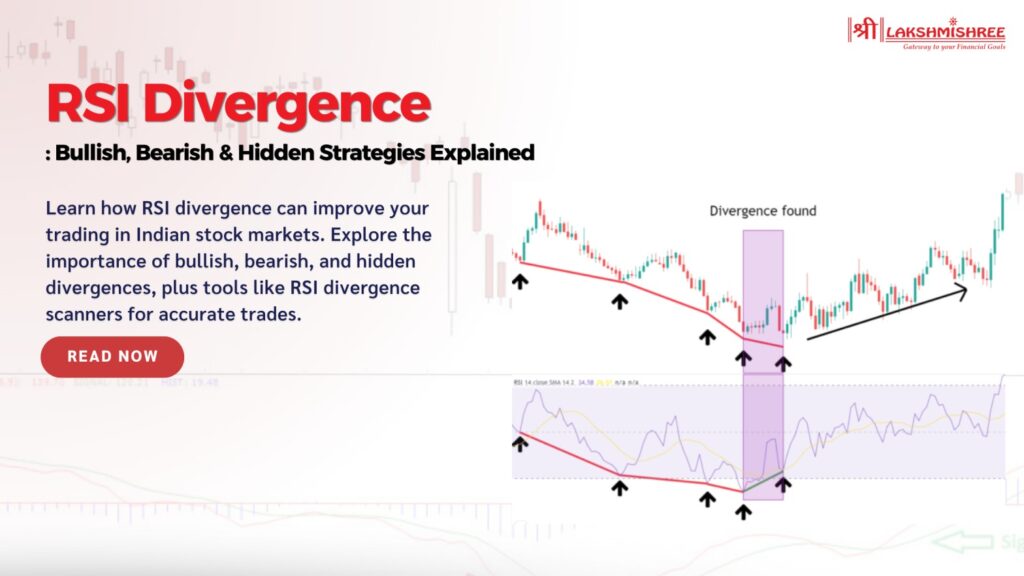
Finding divergence is only the beginning. The actual trade needs a structured process.
A reliable RSI divergence strategy tradingview setup combines divergence with price action confirmation and disciplined risk management.
Step 1: Find Divergence at Support or Resistance
Do not scan RSI in isolation.
First mark:
- Previous swing highs and lows
- Major support
- Major resistance
- Breakout and retest zones
- Previous day high and low
- Important higher-timeframe levels
Then check whether RSI divergence appears around those areas.
For a bullish setup, you want to see price testing meaningful support while RSI forms a higher low.
For a bearish setup, look for price testing resistance while RSI forms a lower high.
📌 High-quality location + divergence is stronger than divergence alone.
Step 2: Wait for Price Action Confirmation
This is the step that prevents many unnecessary losses.
Do not automatically enter when the divergence appears.
Wait for confirmation such as:
- Bullish Engulfing
- Bullish Pin Bar
- Strong rejection wick
- Break above a minor swing high
- Volume expansion
- Break and retest of short-term resistance
For bearish setups, look for the opposite price action.
The idea is simple: RSI suggests that momentum may be changing, while price action gives you evidence that buyers or sellers are actually stepping in.
Step 3: Set Stop Loss and Target Before Entering
Your stop loss should be placed at a logical invalidation point—not at a random percentage.
For bullish divergence, this is commonly below the recent swing low.
For bearish divergence, it can be above the recent swing high.
Then calculate your position size based on the amount you are willing to lose.
A simple target framework is a 1:2 risk-to-reward ratio.
For example:
- Entry: ₹500
- Stop loss: ₹490
- Risk: ₹10 per share
- Target: ₹520
- Potential reward: ₹20 per share
That gives you a 1:2 risk-to-reward setup.
| Trade Component | Bullish Setup | Bearish Setup |
| Divergence | Price lower low + RSI higher low | Price higher high + RSI lower high |
| Location | Support | Resistance |
| Confirmation | Bullish candle/breakout | Bearish candle/breakdown |
| Stop Loss | Below swing low | Above swing high |
| Target | Minimum 1:2 RR | Minimum 1:2 RR |
| Risk | Fixed percentage/amount | Fixed percentage/amount |
💡 Trader’s First-Hand Insight
Consider a Nifty 50 5-minute chart where bullish divergence appears around a strong support zone.
Instead of entering immediately, wait for a bullish engulfing candle and a break above the previous candle’s high. If the setup gives you a clean stop below the swing low and at least 1:2 potential reward, the trade becomes easier to manage.
If price never confirms, no trade is also a valid decision.
⚠️ 3 Critical RSI Divergence Mistakes to Avoid
One of the biggest mistakes when using an RSI divergence strategy tradingview setup is entering before price confirms the signal.
Mistake 1: Trading Divergence Against a Strong Macro Trend
A divergence does not automatically reverse a powerful trend.
During a strong downtrend, you may see multiple bullish divergences before price finally reaches a sustainable bottom.
The same happens during strong rallies with bearish divergence.
📌 Use higher-timeframe structure to understand the dominant trend.
If the daily chart is strongly bearish, be careful about treating every 5-minute bullish divergence as a major reversal.
💡 Trader’s First-Hand Insight
Imagine Bank Nifty is falling aggressively after a major market-wide risk-off move. A 5-minute bullish RSI divergence appears.
You buy expecting a reversal.
Price bounces for ten minutes and then sellers return.
The problem was not necessarily the divergence. The problem was expecting a small-timeframe signal to defeat a much stronger market trend.
Mistake 2: Entering Immediately on the Divergence
This is probably the most expensive beginner mistake.
Divergence is an early warning, not an entry button.
Price can continue making new lows while RSI continues showing divergence.
Instead, wait for confirmation.
A bullish divergence followed by a bullish engulfing candle and a break of short-term structure is much more useful than divergence by itself.
📌 Signal first. Confirmation second. Entry third.
💡 Trader’s First-Hand Insight
A stock can produce bullish divergence for several candles while sellers continue hitting the bid.
If you enter on the first divergence, you may need to sit through multiple lower lows.
Waiting for price to reclaim a nearby swing level can reduce premature entries, even though it may mean entering slightly later.
Mistake 3: Ignoring Higher-Timeframe Context
A 5-minute setup can look perfect while the 1-hour chart tells a completely different story.
Suppose you see bullish RSI divergence on a 5-minute chart, but price is directly underneath strong 1-hour resistance.
There may simply not be enough room for the trade to move.
This is why multi-timeframe analysis is valuable.
Before taking a lower-timeframe divergence trade, ask:
- What is the 1-hour trend?
- Where are the major support and resistance zones?
- Is price close to a major opposing level?
- Does the lower-timeframe setup have enough room to reach a 1:2 target?
💡 Trader’s First-Hand Insight
One of the easiest ways to improve divergence trades is to check the higher timeframe before entering.
A 5-minute bullish divergence near 1-hour resistance is usually less attractive than the same divergence appearing near 1-hour support.
The setup may look identical on the 5-minute chart, but the context is completely different.
📊 How to Use Hidden Divergence on TradingView

Regular divergence gets most of the attention, but hidden divergence TradingView traders can use is valuable when looking for trend continuation.
Bullish Hidden Divergence
- Price makes a higher low.
- RSI makes a lower low.
- The broader trend remains bullish.
- The setup can signal that buyers may continue defending the trend.
Bearish Hidden Divergence
- Price makes a lower high.
- RSI makes a higher high.
- The broader trend remains bearish.
- The setup can support another move lower.
For hidden divergence, trend direction becomes especially important.
📌 If price is clearly trending higher and forms a higher low while RSI makes a lower low, you are not necessarily looking for a major reversal. You are looking for evidence that the existing bullish structure may continue.
💡 Trader’s First-Hand Insight
Suppose Nifty is in a clear intraday uptrend. Price pulls back but holds above its previous swing low. RSI falls sharply and creates a lower low.
That can look bearish if you only watch RSI.
But price has maintained its higher-low structure.
This is where hidden bullish divergence can become useful: RSI is weak, but price structure is still bullish.
🧠 A Simple RSI Divergence Trading Checklist
Before entering a trade, run through this checklist:
| Question | Yes/No |
| Is there a clear RSI divergence? | ☐ |
| Is divergence occurring at meaningful support/resistance? | ☐ |
| Does the higher timeframe support the trade? | ☐ |
| Has price-action confirmation appeared? | ☐ |
| Is volume supporting the move? | ☐ |
| Is the stop at a logical swing point? | ☐ |
| Is at least 1:2 risk-to-reward available? | ☐ |
| Is the position size based on defined risk? | ☐ |
If several answers are No, there is no reason to force the trade.
The best traders are not trying to trade every divergence they see. They are waiting for the divergence that fits their complete trading plan.
Final Thought
Load up TradingView, add a standard 14-period RSI, and start marking regular and hidden divergence around important price levels. Then practice the RSI divergence strategy TradingView setup through historical charts and paper trading before risking real money. The goal is not to predict every reversal—it is to identify repeatable setups, wait for confirmation, control your risk, and let your tested trading plan make the final decision.
Practice the RSI divergence strategy tradingview method on historical charts before risking real money.c