Best Technical Indicators for Beginners: 7 Essential Tools
Trading can feel complicated when you are starting out. There are hundreds of indicators, countless strategies, and conflicting opinions about which tools actually work.
The good news is that you do not need a chart filled with indicators to become a better trader.
The best technical indicators for beginners are usually simple tools that help you understand trend, momentum, volatility, and trading activity. Moving Averages, RSI, MACD, Bollinger Bands, and Volume can all provide useful information when they are used with proper market analysis and risk management.
In this guide, we will explain the most useful indicators for beginners, how each one works, when to use them, common mistakes to avoid, and how to combine a few indicators into a simple trading setup.
Important: Technical indicators are analytical tools, not guaranteed prediction systems. No indicator can tell you with certainty what the market will do next.
What Are Technical Indicators?
Technical indicators are mathematical calculations that use market data—primarily price and, for some indicators, volume—to help traders analyze market conditions.
They are normally displayed directly on a price chart or in a separate panel below it.
Depending on the indicator, they can help traders identify:
- Market trends
- Price momentum
- Potential overbought or oversold conditions
- Volatility
- Possible entry and exit areas
- Breakout confirmation
- Changes in market momentum
For example, a Moving Average can help identify the general direction of a market, while RSI can help traders analyze momentum.
The key is understanding what an indicator is actually measuring rather than blindly following its signals.
For a broader understanding of how technical analysis uses charts, indicators, price, volume, and momentum, see this Fidelity guide to technical analysis.
This is highly relevant because Fidelity explains technical indicators, overlays, oscillators, moving averages, RSI, MACD, Bollinger Bands, volume, and support/resistance.
Why Should Beginners Use Technical Indicators?
Learning the best technical indicators for beginners can make chart analysis easier and help new traders develop a more structured approach.
Understanding the best technical indicators for beginners can help you build a simpler and more structured approach to technical analysis.
New traders often make decisions based on emotions, social-media predictions, or a single candle on the chart.
Indicators can add structure to the analysis.
Instead of asking:
“Should I buy because the price is going up?”
you can ask:
- What is the current trend?
- Is momentum supporting the move?
- Is price near an important support or resistance area?
- Is there enough volume behind the move?
- Where would my stop-loss go?
- Does the potential reward justify the risk?
This creates a more systematic decision-making process.
However, indicators should support your analysis, not replace it.
These best technical indicators for beginners cover the four areas traders need most: trend, momentum, volatility, and market activity.
1. Moving Average
A Moving Average is one of the simplest technical indicators for beginners.
Moving Average is often included among the best technical indicators for beginners because it provides a simple way to identify the market’s general direction.
It calculates the average price over a specific number of periods and plots the result as a line on the chart. This smooths some of the short-term price fluctuations and makes the underlying trend easier to observe.
Common Moving Average periods include:
- 20-period
- 50-period
- 100-period
- 200-period
The meaning of a Moving Average depends on the timeframe.
For example, a 50-period Moving Average on a daily chart is based on 50 trading days, while a 50-period Moving Average on a 5-minute chart is based on the previous 50 five-minute candles.
For beginners, Moving Average is one of the best technical indicators for beginners because its basic trend-following concept is easy to understand.
How to Use Moving Average
A basic approach is to observe the relationship between price and the Moving Average.
- Price above a rising Moving Average can indicate bullish conditions.
- Price below a falling Moving Average can indicate bearish conditions.
- A flat Moving Average may indicate weaker trend conditions.
- Moving Average crossovers can indicate potential changes in momentum.
However, Moving Averages are lagging indicators because they are calculated using historical prices.
A crossover can therefore occur after a significant portion of a move has already happened.
Simple Example
Suppose EUR/USD is trading above a rising 50 EMA and continues to form higher highs and higher lows.
Instead of immediately selling because price looks expensive, a trader could use the EMA as one piece of evidence that the broader trend remains bullish.
The trader would still need to consider support, resistance, price action, risk, and the overall market environment.
Advantages
- Easy to understand
- Useful for identifying trends
- Helps reduce short-term market noise
- Can be used across different timeframes
Limitation
Moving Averages can produce delayed signals and may perform poorly when the market moves sideways.
2. Relative Strength Index (RSI)
The Relative Strength Index, commonly known as RSI, is a momentum oscillator that measures the strength and speed of recent price movements.
RSI ranges from 0 to 100.
The traditional RSI framework uses 70 and 30 as important reference levels.
| RSI Level | Common Interpretation |
|---|---|
| Above 70 | Potentially overbought |
| Around 50 | Momentum balance/transition |
| Below 30 | Potentially oversold |
For additional details on RSI and how overbought and oversold conditions work, see this RSI guide from Fidelity.
Fidelity specifically notes that RSI ranges from 0–100, traditionally uses 70/30 as reference levels, and can remain overbought or oversold during strong trends.
How to Use RSI
Many beginners make a common mistake: they assume RSI above 70 automatically means they should sell.
That is not necessarily true.
In a strong bullish trend, RSI can remain above 70 while price continues moving higher.
Similarly, RSI can remain below 30 during a strong bearish trend.
Therefore, RSI should be interpreted in the context of the broader market trend.
For example:
Bullish market:
Price is above a rising 50 EMA, while RSI pulls back toward the 40–50 area and then begins moving higher again.
A trader could interpret this as momentum recovering within an existing bullish trend.
This is different from simply buying every time RSI falls below 30.
What RSI Can Help Identify
RSI can be useful for:
- Measuring momentum
- Identifying potential momentum shifts
- Studying overbought and oversold conditions
- Finding possible divergence
- Confirming a broader trading setup
RSI Divergence
Divergence occurs when price and an indicator move differently.
For example, if price creates a higher high while RSI creates a lower high, it may indicate that bullish momentum is weakening.
However, divergence is not a guaranteed reversal signal.
Price can continue trending even after divergence appears.
3. MACD
MACD stands for Moving Average Convergence Divergence.
It is a trend-following momentum indicator that can help traders analyze changes in momentum and trend direction.
MACD typically consists of:
- MACD line
- Signal line
- Histogram
You can also learn more about MACD signals and its calculation in this MACD guide from Fidelity.
Fidelity explains MACD’s signal-line crossovers, zero-line interpretation, divergence, and its tendency to produce whipsaws in trading ranges.
How MACD Works
When the MACD line moves above the signal line, traders may interpret this as increasing bullish momentum.
When the MACD line moves below the signal line, it may indicate weakening or bearish momentum.
But, just like other indicators, crossovers should not be treated as automatic buy or sell signals.
Why Beginners May Find MACD Useful
MACD combines elements of trend and momentum analysis.
It can help traders:
- Identify momentum changes
- Confirm a developing trend
- Study potential reversals
- Compare current momentum with previous price movement
MACD Example
Imagine a stock has been declining for several sessions.
The price begins stabilizing near a previous support zone. At the same time, the MACD histogram starts improving and the MACD line eventually crosses above the signal line.
Instead of buying solely because of the crossover, a trader could use the MACD signal as additional confirmation alongside support and price action.
That creates a stronger decision-making process than relying on one indicator alone.
4. Bollinger Bands
Bollinger Bands are designed to help traders analyze price volatility.
They generally consist of three components:
- Middle Band
- Upper Band
- Lower Band
The middle band is typically a Moving Average, while the outer bands adjust according to market volatility.
When volatility increases, the bands tend to expand.
When volatility decreases, the bands tend to contract.
For a deeper explanation of volatility and Bollinger Bands, see this Bollinger Bands guide from Fidelity
How Beginners Can Use Bollinger Bands
Bollinger Bands can help traders study:
- Volatility
- Potential breakout conditions
- Price expansion and contraction
- Range-bound markets
When price reaches the upper band, it does not automatically mean the market must fall.
Likewise, touching the lower band does not automatically mean the market must rise.
Price can “walk” along a Bollinger Band during a strong trend.
Bollinger Band Squeeze
One popular concept is the Bollinger Band squeeze.
When volatility contracts significantly, the bands become narrower.
Some traders watch for a subsequent expansion in volatility as price begins making a stronger move.
However, the squeeze itself does not reliably tell you whether the eventual breakout will be bullish or bearish.
Price structure and confirmation remain important.
5. Volume
Volume measures how much trading activity occurred during a particular period.
It can provide useful context when combined with price movement.
For example:
- Price rising with increasing volume may show stronger participation.
- A breakout accompanied by increased volume may attract more attention from traders.
- A price move occurring on relatively low volume may require additional confirmation.
However, volume interpretation depends on the market.
For stocks and exchange-traded products, exchange-reported volume can be directly useful. In decentralized markets such as spot forex, the volume displayed by a trading platform may represent tick activity rather than centralized total market volume.
Why Volume Matters
Price tells you what happened.
Volume can provide additional information about how much trading activity accompanied that movement.
This makes volume a useful confirmation tool rather than a standalone trading signal.
6. Support and Resistance
Support and resistance are not technically indicators, but beginners should understand them because they are fundamental parts of technical analysis.
What Is Support?
Support is an area where buying interest has previously helped slow or stop a decline.
What Is Resistance?
Resistance is an area where selling pressure has previously helped slow or stop an advance.
These should generally be treated as zones rather than perfectly precise lines.
Markets can move slightly through a level before reversing, and previous support can sometimes become resistance after a breakdown.
How Beginners Can Use Support and Resistance
These areas can help traders identify:
- Potential entry zones
- Stop-loss locations
- Profit targets
- Breakout areas
- Possible reversal zones
For example, if price approaches an established resistance zone while RSI shows weakening momentum, a trader may become more cautious about opening a fresh long position.
The important point is that the indicators provide context. They do not guarantee what happens next.
7. Exponential Moving Average (EMA)
An Exponential Moving Average is a type of Moving Average that gives greater weight to more recent prices.
As a result, an EMA generally responds faster to recent price changes than a simple Moving Average.
Popular EMAs include:
- 20 EMA
- 50 EMA
- 100 EMA
- 200 EMA
Why Beginners Use EMA
The EMA is particularly popular among short-term and intraday traders because it can react more quickly to changing market conditions.
For example, a trader might use:
50 EMA = trend filter
RSI = momentum confirmation
Support/resistance = trade location
This creates a relatively simple framework without putting multiple overlapping indicators on the chart.
Best Technical Indicator Combination for Beginners
A combination of the best technical indicators for beginners can provide trend, momentum, and volume information without overcrowding the chart.
A combination of the best technical indicators for beginners can provide more context than relying on a single indicator.
There is no single indicator combination that works in every market.
However, beginners can start with a simple structure where each tool has a specific purpose.
A Simple Three-Part Setup
1. 50 EMA — Trend
Use the EMA to understand the broader directional bias.
2. RSI — Momentum
Use RSI to determine whether momentum supports the potential setup.
3. Volume — Confirmation
Use volume to assess whether increased trading activity accompanies important price movements.
You can also add support and resistance to determine where a trade makes sense.
Example of a Bullish Setup
Imagine a stock is trading above a rising 50 EMA.
Price then pulls back toward an established support zone.
RSI declines during the pullback but begins recovering.
At the same time, price produces a bullish reversal candle around support.
If volume increases during the subsequent upward move, the trader now has several pieces of evidence supporting the bullish idea.
The trade is still not guaranteed to work.
Before entering, the trader should determine:
- Entry price
- Stop-loss
- Profit target
- Maximum acceptable risk
- Risk-to-reward ratio
This is much more useful than buying simply because three indicators turned green.
How Many Indicators Should a Beginner Use?
There is no mandatory number.
For many beginners, two or three complementary tools are enough.
A useful framework is:
| Purpose | Possible Tool |
|---|---|
| Trend | 50 EMA |
| Momentum | RSI |
| Volatility | Bollinger Bands |
| Confirmation | Volume |
| Price location | Support & Resistance |
You do not need to use all five.
The best setup is often the one you understand well enough to apply consistently.
Common Mistakes Beginners Make With Indicators
1. Using Too Many Indicators
Adding more indicators does not automatically improve your strategy.
If five indicators are all giving similar momentum information, you may simply be looking at the same market information from different angles.
Keep your chart clean.
2. Treating Every Signal as a Trade
An RSI reading above 70 does not automatically mean sell.
A MACD crossover does not automatically mean buy.
A Moving Average crossover does not guarantee a new trend.
Every signal needs market context.
3. Ignoring Price Structure
Indicators are calculated from market data. They should not make you ignore obvious price levels.
Always consider:
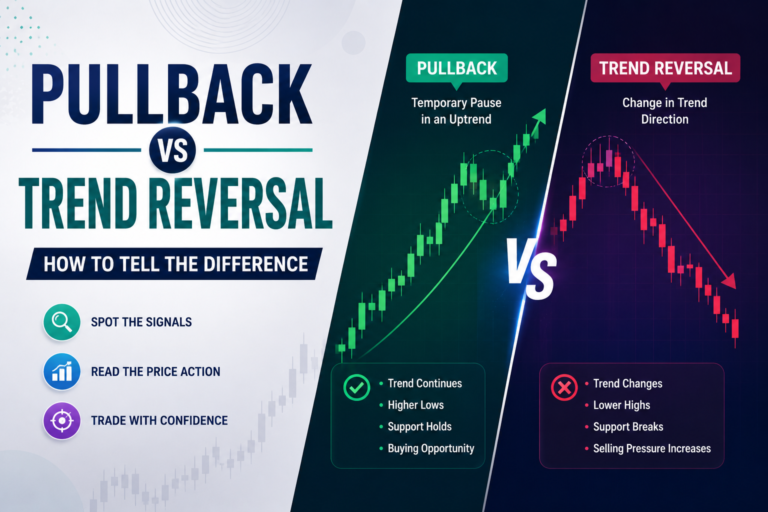
- Higher highs and higher lows
- Lower highs and lower lows
- Support
- Resistance
- Breakouts
- Failed breakouts
- Consolidation
4. Ignoring Risk Management
A good indicator cannot protect an oversized trading position.
Before entering a trade, know how much money you are willing to lose if the setup fails.
A simple risk-management process includes:
- Predetermined stop-loss
- Controlled position size
- Defined maximum risk per trade
- Realistic profit target
- Trading plan
5. Changing Indicators After Every Loss
One losing trade does not automatically mean your indicator is broken.
Trading involves uncertainty.
Evaluate a strategy over a meaningful sample of trades instead of changing your system after every individual result.
6. Not Backtesting or Practicing
Before using an indicator strategy with real money, test it.
You can use historical charts or a demo account to study how your rules perform in different market conditions.
Track:
- Entry
- Stop-loss
- Target
- Market condition
- Indicator readings
- Trade outcome
- Reason for taking the trade
This turns random trading into a measurable process.
Are Technical Indicators Accurate?
No technical indicator is 100% accurate.
Indicators work with historical market data and can produce false signals.
A strategy that performs well during a strong trend may behave very differently in a sideways market.
Similarly, an indicator setup that works on one asset or timeframe may not produce the same results on another.
Instead of asking:
“Which indicator has the highest accuracy?”
a better question is:
“Does this indicator improve my decision-making when combined with clear trading rules and risk management?”
That is a much more useful way to evaluate a trading indicator.
If you are still deciding which tools to learn first, focusing on the best technical indicators for beginners can help you avoid unnecessary complexity.
Which Technical Indicator Is Best for Beginners?
If you are completely new to technical analysis, start with Moving Average, RSI, and Volume.
Each serves a different purpose:
- Moving Average: helps identify trend
- RSI: helps analyze momentum
- Volume: provides information about trading activity
Then learn support and resistance before adding more indicators.
Once you understand these basics, you can explore MACD, Bollinger Bands, and more advanced technical-analysis techniques.
The goal should not be to find a magical indicator.
The goal is to develop a repeatable trading process.
A Beginner-Friendly Indicator Strategy
Here is an illustrative framework that beginners can study:
Step 1: Identify the Trend
Use the 50 EMA.
If price is consistently above a rising EMA, look for potential bullish setups.
If price is consistently below a falling EMA, look for potential bearish setups.
Step 2: Mark Key Levels
Identify nearby support and resistance zones.
Avoid entering trades directly into major opposing levels without considering the available room for price movement.
Step 3: Check Momentum
Use RSI to determine whether momentum supports the setup.
Do not use RSI 70/30 as an automatic buy or sell trigger.
Step 4: Wait for Price Confirmation
Look for a clear price-action signal around an important area.
Examples include:
- Rejection candle
- Breakout
- Break-and-retest
- Strong continuation candle
Step 5: Check Volume When Appropriate
If volume data is meaningful for the market you are trading, check whether trading activity supports the move.
Step 6: Define Risk Before Entry
Determine your stop-loss and position size before placing the trade.
Step 7: Record the Trade
Write down why you entered and what happened afterward.
After enough trades, you can evaluate whether your rules actually provide an edge.
Technical Indicators vs Price Action
Indicators and price action do not have to compete with each other.
They can work together.
For example:
Price action: Price breaks resistance.
EMA: Trend is bullish.
RSI: Momentum remains supportive.
Volume: Trading activity increases during the breakout.
Instead of relying on one signal, you now have multiple pieces of market information pointing in the same direction.
That does not guarantee a winning trade, but it can create a more structured setup.
Which Indicators Work Best for Intraday Trading?
Intraday traders often use indicators that help them understand short-term trend, momentum, and volatility.
Popular choices include:
- 9 EMA or 20 EMA
- 50 EMA
- RSI
- VWAP
- Volume
- Bollinger Bands
- MACD
However, the best combination depends on the asset and trading timeframe.
For example, an indicator setup designed for a 1-minute chart should not automatically be applied to a daily chart without testing it first.
Timeframe changes the meaning of the signals.
Which Indicators Should Beginners Avoid?
Beginners do not necessarily need to avoid specific indicators.
The bigger problem is using an indicator without understanding what it measures.
Be cautious with:
- Highly complicated custom indicators
- Systems that promise guaranteed profits
- Indicators marketed as “100% accurate”
- Strategies based entirely on buy/sell arrows
- Setups containing many overlapping indicators
If you cannot explain why an indicator generates a signal, you probably should not build your trading strategy around it.
Final Thoughts
The best technical indicators for beginners are not necessarily the most complicated ones.
Moving Averages can help you understand trend. RSI can help analyze momentum. MACD can provide additional trend and momentum information. Bollinger Bands can help study volatility, while Volume can provide useful information about trading activity.
But no indicator can predict the market with certainty.
The strongest approach is to combine technical indicators with price structure, support and resistance, disciplined risk management, and a clearly defined trading plan.
Start with a small number of tools. Learn what they measure. Test your rules on historical data or a demo account. Then evaluate your results over a meaningful sample rather than judging your strategy from a handful of trades.
Trading is not about finding an indicator that never loses.
It is about building a process that manages uncertainty and protects your capital while giving you a consistent way to make decisions.