5 High-Probability Candlestick Patterns for Swing Trading (With Chart Examples)
Direct Answer: The 5 Candlestick Patterns Swing Traders Should Know
Candlestick patterns for swing trading are visual formations that help traders understand the battle between buyers and sellers during a specific period. For swing traders, however, a pattern by itself is not a reliable signal. Where the pattern forms matters more than the pattern itself. A bullish candle at major support can be far more meaningful than the same candle appearing in the middle of a range.
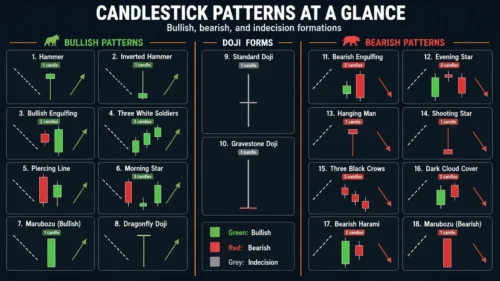
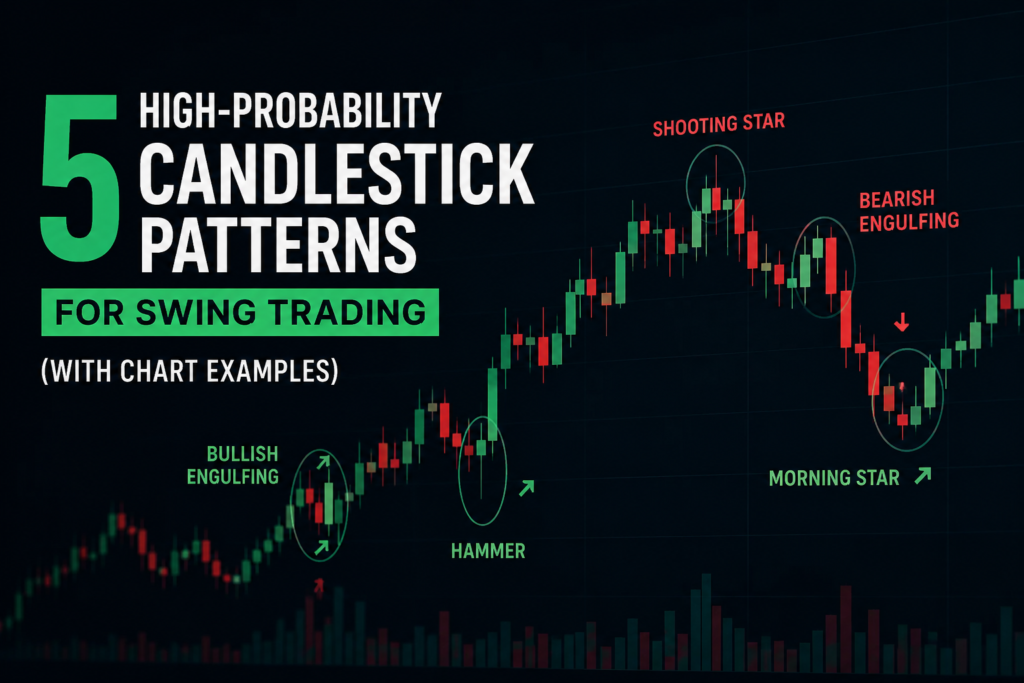
The five patterns covered in this guide are Bullish/Bearish Engulfing, Morning/Evening Star, Pin Bar/Hammer, Three Line Strike, and Piercing Line/Dark Cloud Cover. We’ll look at how to identify them, confirm the setup, enter trades, and manage risk on the daily and 4-hour charts.
1. The Golden Rule of Candlestick Trading: Location > Pattern
One of the biggest mistakes beginners make is seeing a candlestick formation and immediately entering a trade.
For example, imagine you see a bullish engulfing candle. It looks powerful, so you buy.
But where did it form?
If it appeared directly underneath a strong resistance level after an extended rally, the setup may have very little room to move. The candle could simply be a temporary pause before sellers take control again.
This is why experienced traders follow a simple principle:
Location first. Pattern second. Confirmation third.
A candlestick pattern becomes significantly more useful when it forms at a meaningful technical area such as:
- Major support or resistance
- Previous swing highs or lows
- Trendlines
- Moving averages
- Breakout and retest zones
- Fibonacci retracement areas
- Demand and supply zones
- Psychological price levels
Example of Context
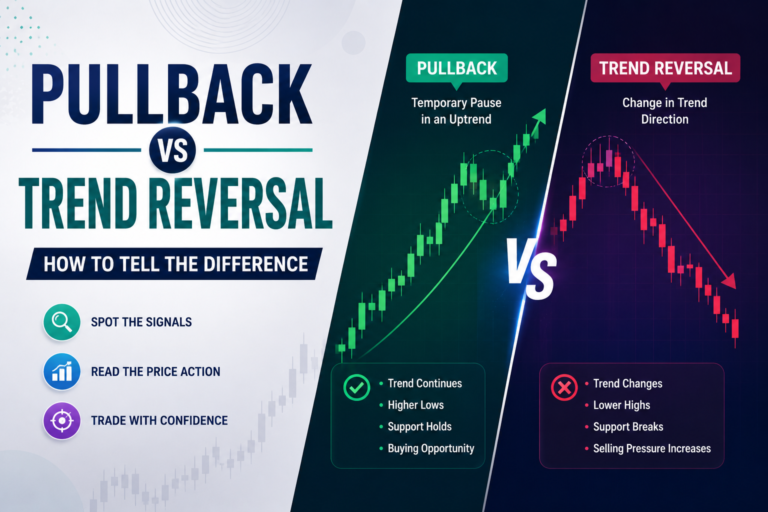
Suppose EUR/USD has been making higher highs and higher lows.
Price pulls back toward previous support and forms a bullish pin bar.
You now have three pieces of information:
- The broader trend is bullish.
- Price has reached an important support zone.
- Buyers have rejected lower prices through the pin bar.
That is much stronger than simply saying, “I found a pin bar, so I should buy.”
The pattern is the trigger. The location provides the reason.
This is a core principle of [Price Action Trading Strategy], where traders focus on market structure, support and resistance, and actual price behavior rather than relying on a single indicator.
2. The 5 High-Probability Candlestick Patterns
1. Bullish and Bearish Engulfing
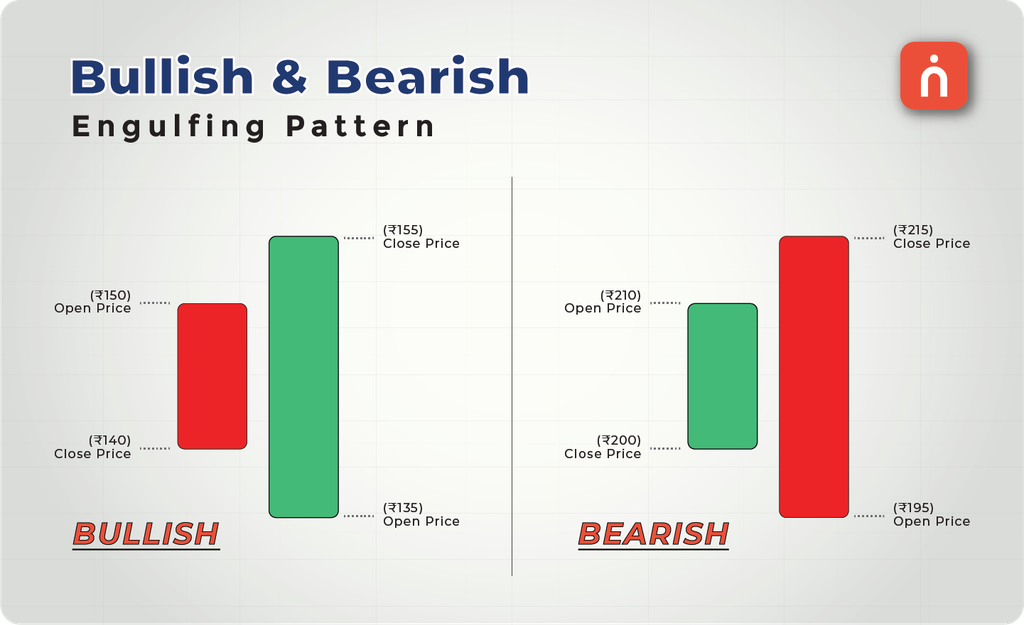
The engulfing pattern is one of the most popular reversal formations among swing traders.
Bullish and bearish engulfing formations are among the most widely watched candlestick patterns for swing trading because they can highlight potential changes in short-term momentum.
Bullish Engulfing
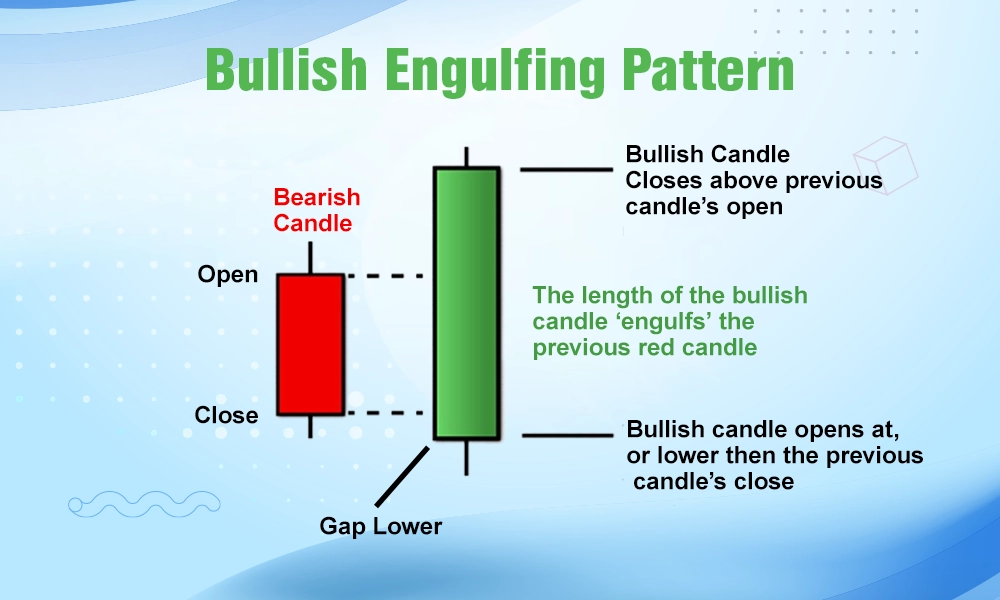
A bullish engulfing pattern generally consists of:
- A bearish candle
- Followed by a larger bullish candle
- The second candle completely engulfs the previous candle’s real body
It suggests that sellers initially controlled the market but buyers stepped in aggressively.
If you’re still learning how individual bullish formations work, check out our detailed guide to [Bullish Candlestick Patterns] before using these setups in live markets.
Bearish Engulfing
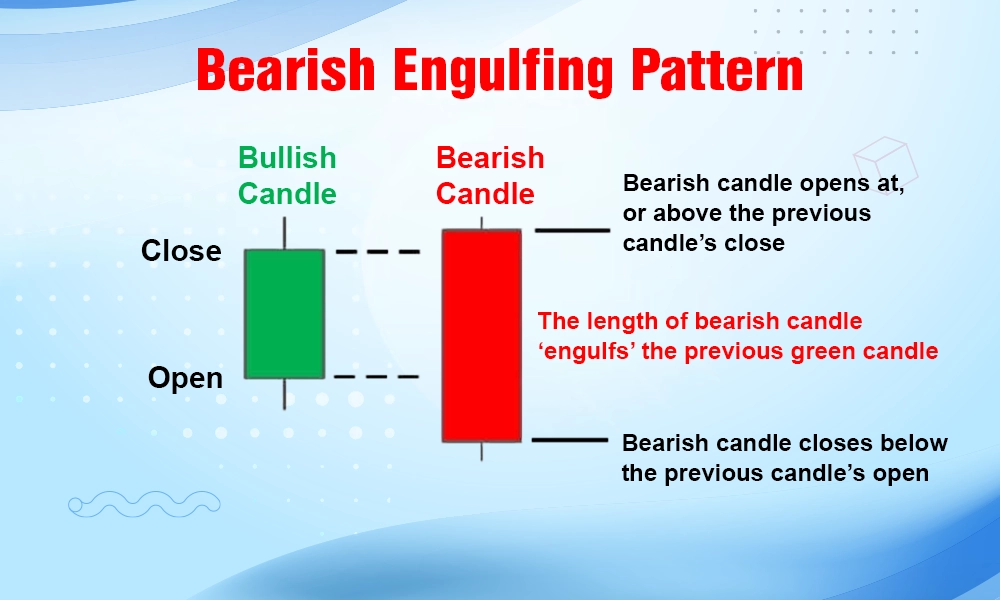
A bearish engulfing pattern is the opposite:
- A bullish candle appears first
- A larger bearish candle follows
- The bearish candle engulfs the previous candle’s body
This indicates that sellers have potentially taken control.
Best Timeframe
4-hour and daily charts
The pattern can appear on lower timeframes, but higher timeframes generally provide cleaner swing-trading signals.
Confirmation Signal
Look for:
- Support or resistance
- A clear trend
- Increased momentum
- Break of the engulfing candle’s high or low
Entry Trigger
For a bullish setup, traders can consider an entry after price breaks above the bullish engulfing candle’s high.
For a bearish setup, an entry can be considered after price breaks below the bearish engulfing candle’s low.
Avoid blindly entering at the close. Waiting for confirmation can help reduce false signals, although it may result in a less favorable entry price.
2. Morning Star and Evening Star
Morning Star and Evening Star formations can become useful candlestick patterns for swing trading when they appear at major support or resistance.
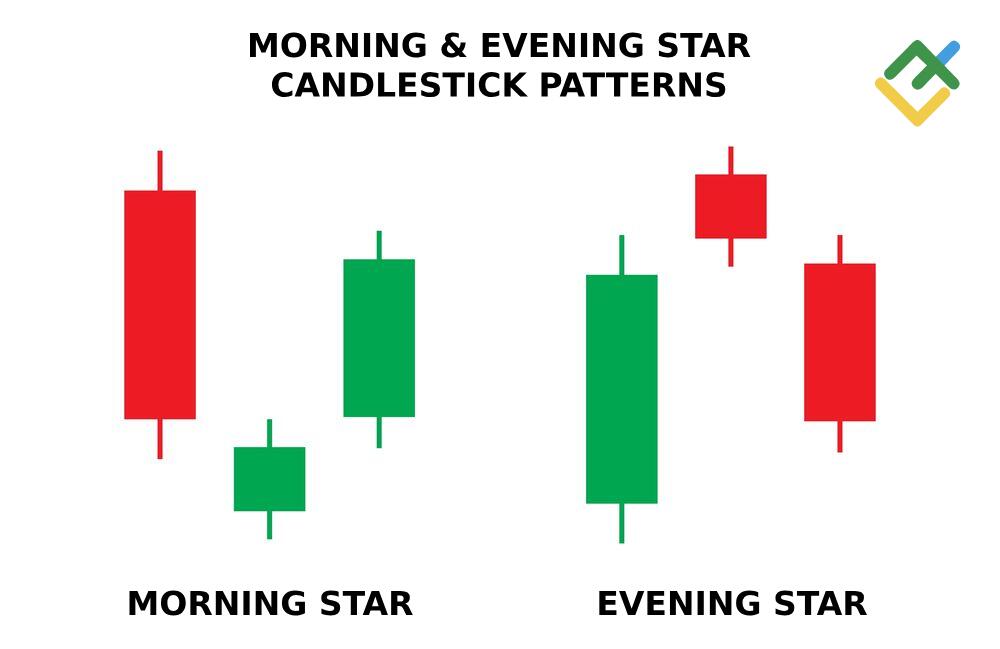
The Morning Star and Evening Star are three-candle reversal formations.
Morning Star
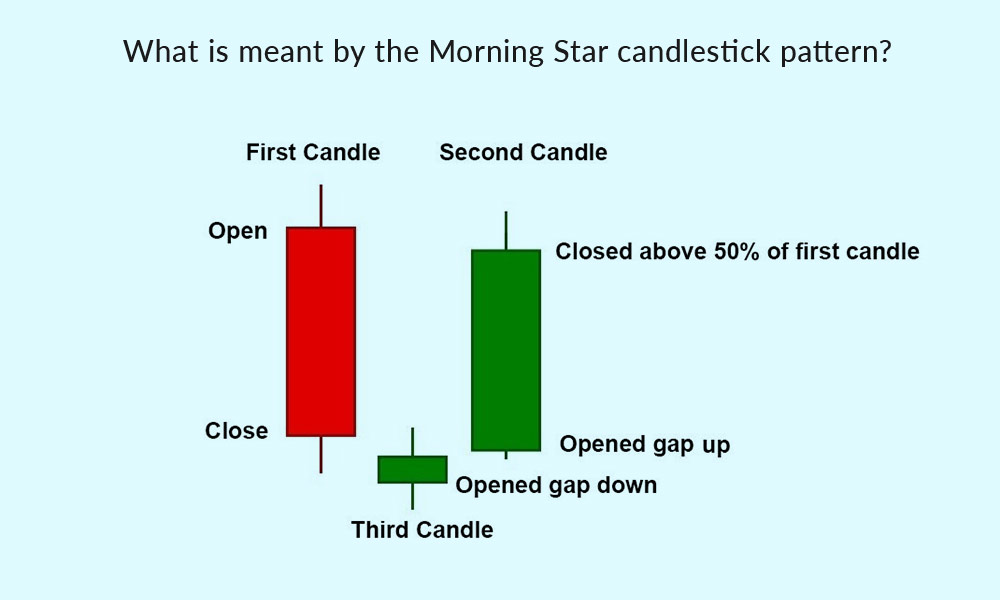
The Morning Star typically appears after a decline and contains:
- A strong bearish candle
- A small-bodied candle showing hesitation
- A strong bullish candle
The formation suggests that selling pressure is weakening and buyers may be returning.
Evening Star
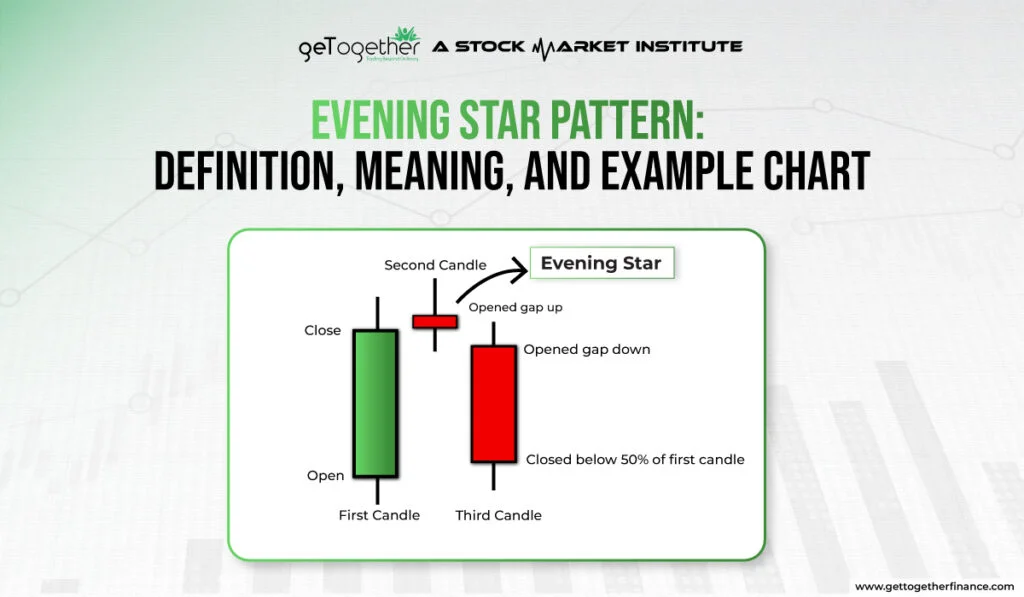
The Evening Star is the bearish counterpart.
It generally forms after an advance:
- Strong bullish candle
- Small-bodied candle
- Strong bearish candle
It can indicate that buyers are losing control.
Best Timeframe
Daily and 4-hour charts
These patterns can be particularly useful when they develop around major support or resistance.
Confirmation Signal
For a Morning Star, look for:
- Price holding a support zone
- Strong bullish third candle
- Break above the pattern’s nearby resistance
For an Evening Star:
- Price rejecting resistance
- Strong bearish third candle
- Break below nearby support
Entry Trigger
A conservative Morning Star entry can occur when price breaks above the third candle’s high.
For an Evening Star, traders can wait for price to break below the third candle’s low.
The key is not simply seeing three candles. The formation should make sense within the market structure.
3. Pin Bar and Hammer
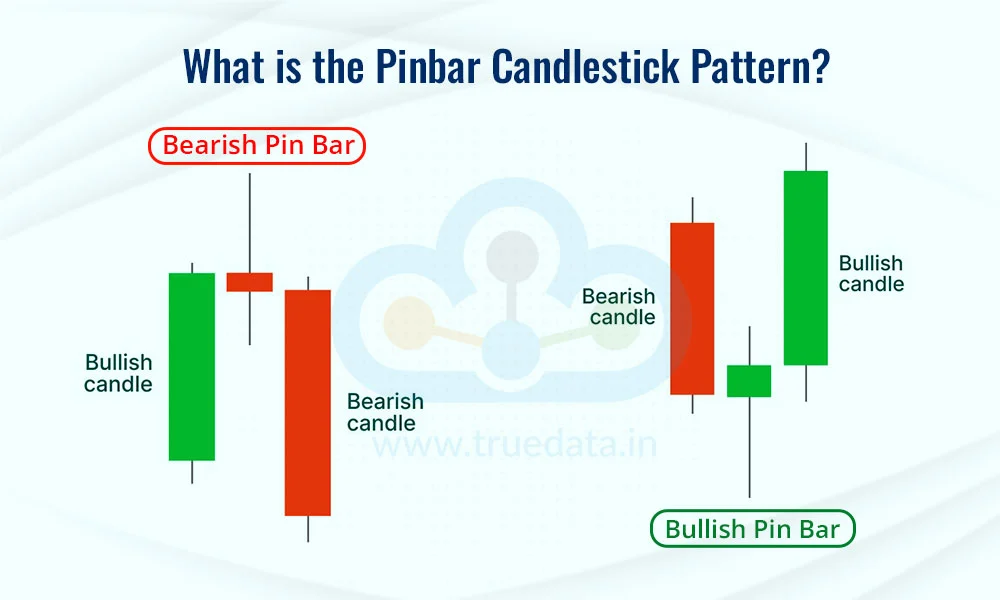
The pin bar is one of the simplest price-action patterns, but it can be extremely useful when it forms at the right location.
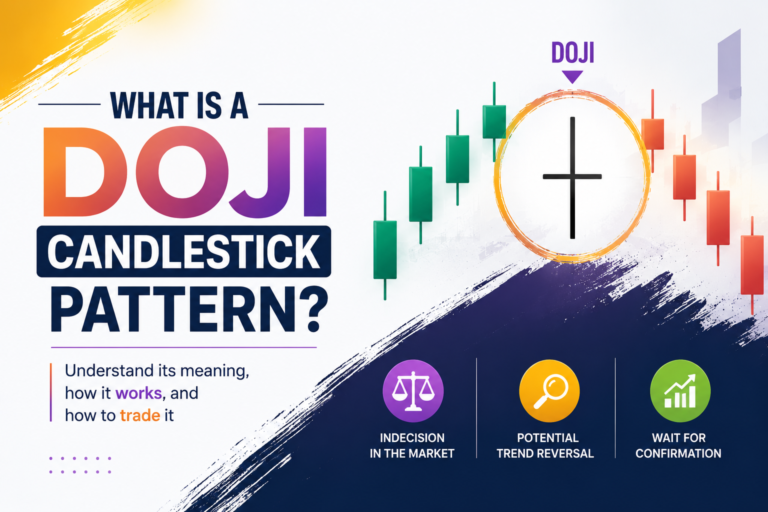
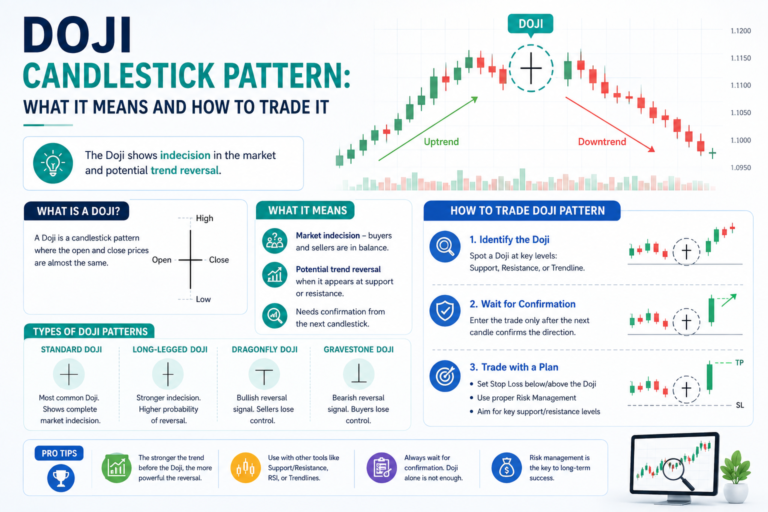
A pin bar has a relatively small body and a long wick.
The long wick represents price rejection.
Pin bars and hammers are popular candlestick patterns for swing trading because their long wicks can reveal rejection of important price levels.
Bullish Pin Bar
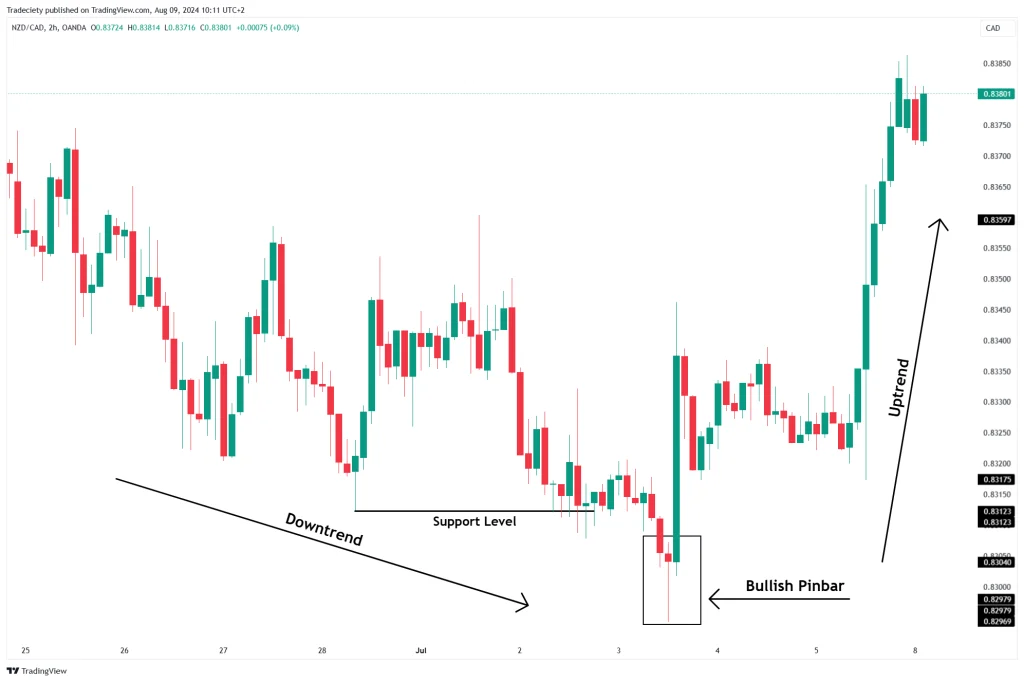
A bullish pin bar generally has:
- A long lower wick
- A relatively small body
- A close toward the upper portion of the candle
It suggests that sellers pushed price lower but buyers rejected those lower levels.
Bearish Pin Bar
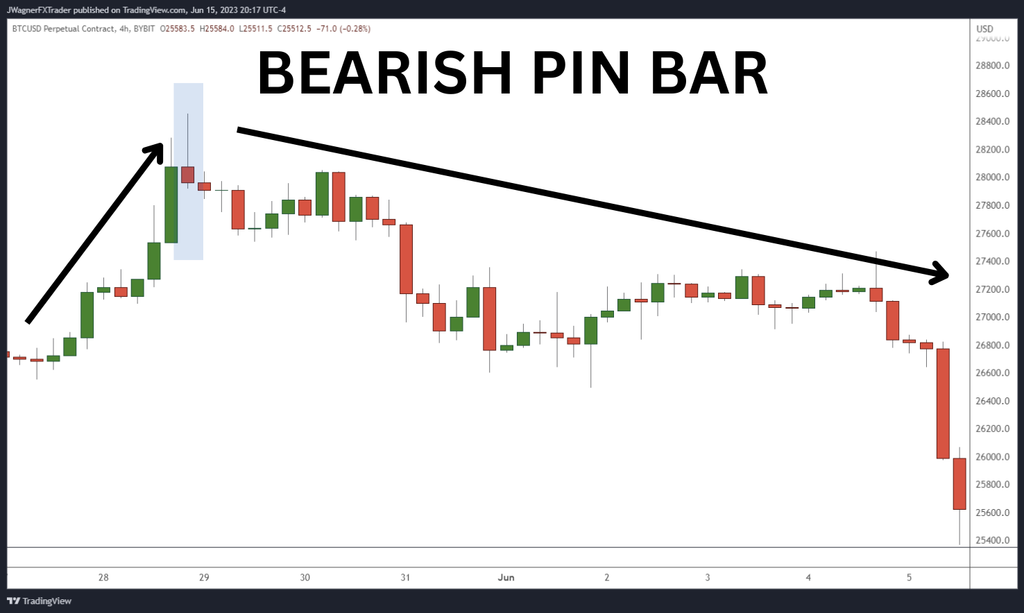
A bearish pin bar has:
- A long upper wick
- A relatively small body
- A close toward the lower portion
This suggests rejection of higher prices.
Hammer
A hammer is a specific candlestick formation that can appear after a decline. It has a small real body and a long lower shadow.
When a hammer forms at meaningful support, it can provide a bullish reversal signal.
Best Timeframe
4-hour and daily charts
Confirmation Signal
A pin bar becomes more meaningful when it forms:
- At major support
- At major resistance
- At a previous swing point
- Near a trendline
- After a liquidity sweep or false breakout
Entry Trigger
For a bullish pin bar, traders can wait for a break above the pin bar’s high.
For a bearish pin bar, traders can wait for a break below its low.
A common stop-loss approach is placing the stop beyond the wick, provided the distance is appropriate for the trade’s risk.
4. Three Line Strike
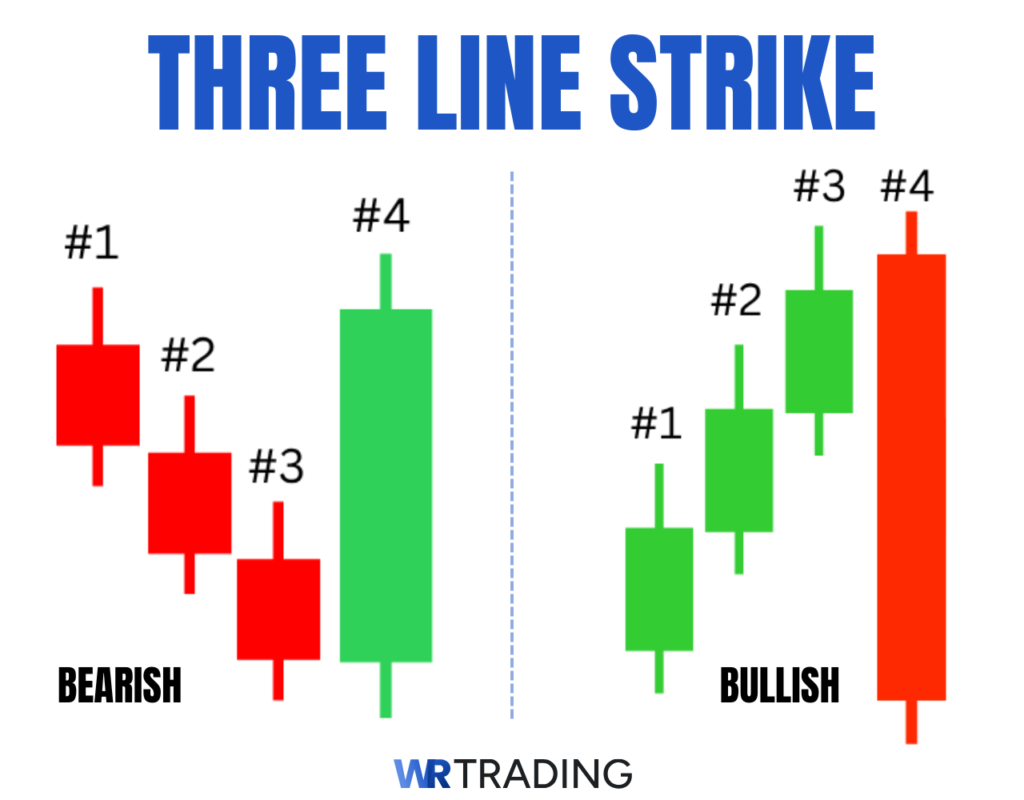
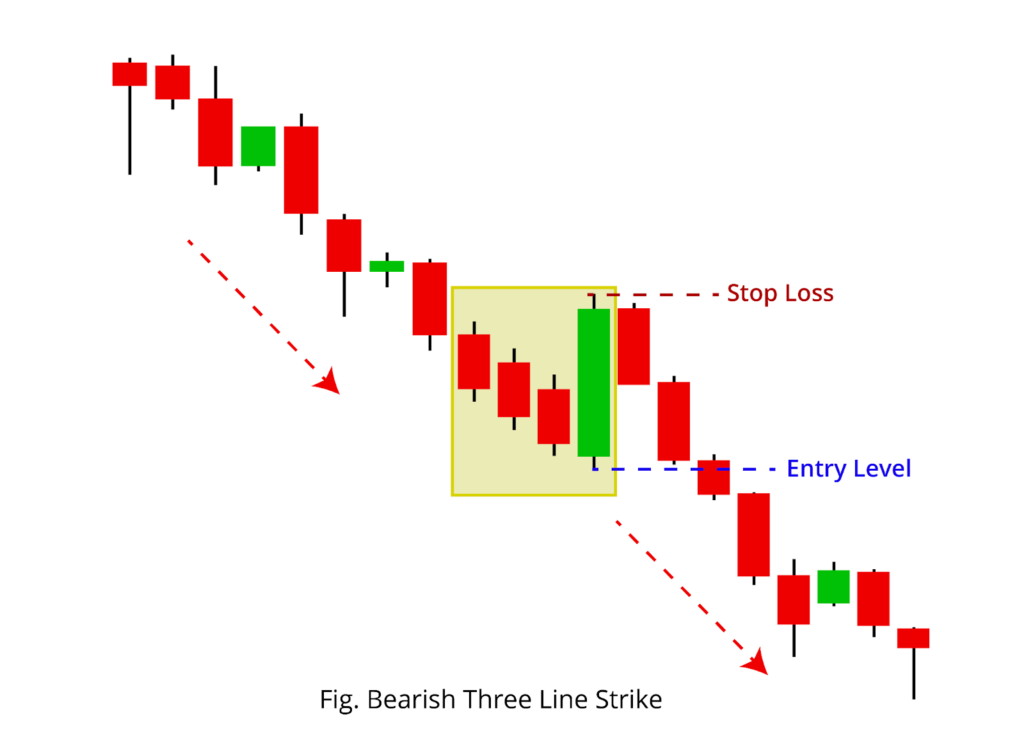
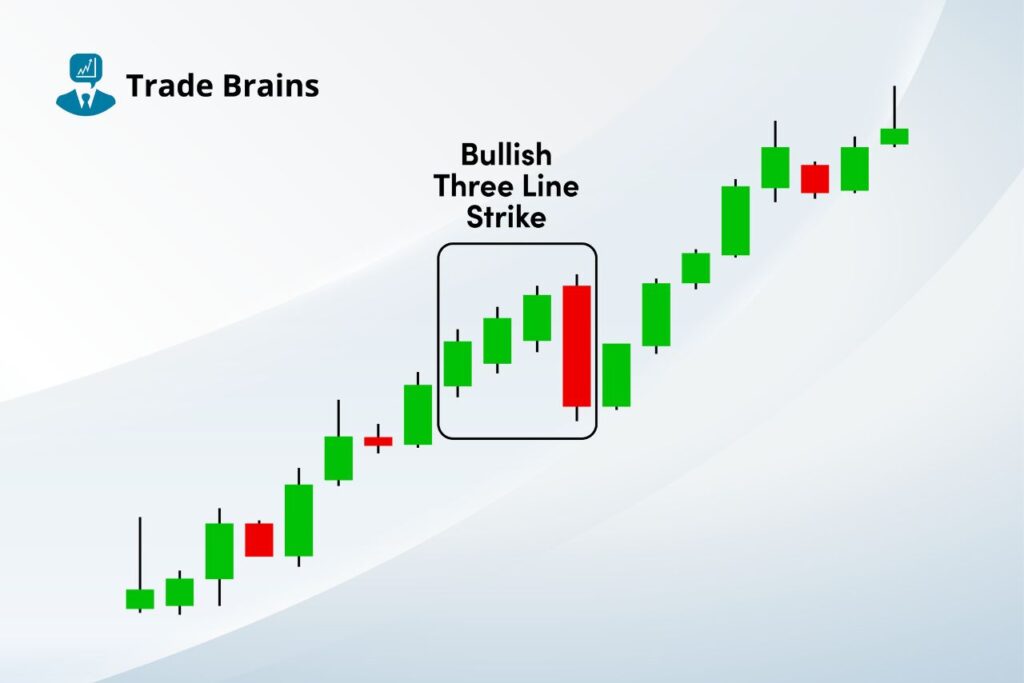
The Three Line Strike is less common than engulfing patterns but can provide interesting continuation or reversal information.
A typical bullish Three Line Strike consists of:
- Three consecutive bearish candles
- Each candle continues making downward progress
- A large bullish candle follows and moves back through the previous three candles
The bearish version is the opposite.
However, traders should be careful with this formation because variations exist in how the pattern is defined.
Why It Matters
The pattern can indicate a dramatic shift in short-term momentum.
For example, after several bearish candles, a large bullish candle completely reverses the recent move. If this occurs at major support, it may provide stronger evidence that sellers are becoming exhausted.
Best Timeframe
4-hour and daily charts
Swing traders can also improve their analysis by using [Multi-Timeframe Analysis on TradingView] to confirm the broader trend before entering a 4-hour setup.
Confirmation Signal
Look for:
- A strong trend before the formation
- Major support or resistance
- A large reversal candle
- Follow-through on the next candle
Entry Trigger
For a bullish setup, traders may wait for price to break above the reversal candle’s high.
For a bearish setup, wait for a break below its low.
Because the final candle can be relatively large, don’t forget to calculate your risk before entering.
A strong-looking candle is not automatically a good-risk trade.
5. Piercing Line and Dark Cloud Cover
The Piercing Line and Dark Cloud Cover are two-candle reversal patterns.
Piercing Line
The Piercing Line generally forms after a decline.
The structure includes:
- A bearish candle
- Followed by a bullish candle
- The bullish candle closes substantially into the previous bearish candle’s body
It suggests that buyers have entered the market strongly enough to recover a significant portion of the previous decline.
Dark Cloud Cover
Dark Cloud Cover is the bearish counterpart.
It usually appears after an advance:
- A bullish candle forms
- A bearish candle follows
- The bearish candle closes deeply into the previous bullish candle
This can signal increasing selling pressure.
Best Timeframe
Daily and 4-hour charts
Confirmation Signal
The strongest setups usually occur around:
- Resistance
- Support
- Previous swing points
- Trendline tests
- Extended price movements
Entry Trigger
For a Piercing Line, traders can wait for a break above the second candle’s high.
For Dark Cloud Cover, traders can wait for a break below the second candle’s low.
This confirmation approach helps prevent acting on a pattern before the market has actually demonstrated follow-through.
The following comparison highlights how these candlestick patterns for swing trading can be used across 4-hour and daily charts.
3. Candlestick Patterns Summary Table
| Pattern | Market Bias | Target Timeframe | Win-Rate Potential |
|---|---|---|---|
| Bullish/Bearish Engulfing | Reversal | 4H / Daily | High when aligned with structure |
| Morning/Evening Star | Reversal | 4H / Daily | High with strong S/R |
| Pin Bar / Hammer | Reversal | 4H / Daily | High at key levels |
| Three Line Strike | Continuation/Reversal | 4H / Daily | Moderate to High with confirmation |
| Piercing Line / Dark Cloud Cover | Reversal | 4H / Daily | Moderate to High with context |
Important Note About “Win Rate”
There is no universal win rate for any candlestick pattern.
A pattern’s performance depends on the market, timeframe, entry rules, stop-loss distance, target, trend conditions, volatility, and trading costs.
Therefore, avoid claims such as “this pattern wins 80% of the time.”
Instead, treat the table as a qualitative guide to potential setup quality, not a guaranteed statistical outcome.
A serious trader should backtest their exact setup before risking real money.
4. Exit Strategies and Risk Management
Finding a good entry is only half of swing trading.
Your exit strategy and position sizing can determine whether a strategy remains profitable over a large sample of trades.
Proper position sizing and stop-loss placement are essential parts of [Risk Management in Trading], especially when candlestick setups produce false signals.
Place Stops Behind the Pattern’s Tail
One practical approach is to place the stop-loss beyond the candlestick’s rejection area.
For example:
Bullish Pin Bar
If you buy after a bullish pin bar, the stop may be placed below the pin bar’s lower wick.
Bearish Pin Bar
For a bearish pin bar, the stop may be placed above the upper wick.
The same concept can be adapted to engulfing patterns and other reversal formations.
However, don’t place a stop at an arbitrary distance simply because “the wick is the stop.”
Consider:
- Market volatility
- Average True Range (ATR)
- Nearby support/resistance
- Position size
- Overall account risk
Use Risk-to-Reward Instead of Chasing Win Rate
Suppose you risk ₹1,000 on a trade and target ₹2,000.
Your risk-to-reward ratio is:
1:2
You don’t necessarily need an extremely high win rate to remain profitable.
For example, over 10 trades:
- 4 winners × ₹2,000 = ₹8,000
- 6 losers × ₹1,000 = ₹6,000
- Net result = ₹2,000 profit
This is why professional traders don’t focus only on being right.
They focus on controlling how much they lose when they’re wrong.
Take Profit at Logical Market Levels
Instead of choosing an arbitrary target, look for areas where price could reasonably react.
Potential targets include:
- Previous swing highs
- Previous swing lows
- Resistance zones
- Support zones
- Supply and demand areas
- Measured price moves
A swing trader may also scale out of a position.
For example:
Target 1: Close part of the position at 1R.
Target 2: Hold the remaining position toward the next major resistance level.
This can help balance profit-taking with the possibility of catching a larger move.
How to Combine Candlestick Patterns With Market Structure
The strongest approach isn’t:
“I see a bullish candle, therefore I buy.”
Instead, think through the trade in sequence:
Combining candlestick patterns for swing trading with trend direction and market structure can help traders avoid taking signals in poor locations.
Step 1: Identify the Trend
Ask whether the market is making:
- Higher highs and higher lows
- Lower highs and lower lows
- Or moving sideways
Step 2: Mark Important Levels
Identify major:
- Support
- Resistance
- Swing highs
- Swing lows
- Breakout zones
Step 3: Wait for Price to Reach the Area
Don’t chase price in the middle of nowhere.
Wait for the market to come to your level.
Step 4: Look for a Candlestick Signal
Now look for:
- Engulfing candle
- Pin bar
- Hammer
- Morning/Evening Star
- Piercing Line
- Dark Cloud Cover
Step 5: Confirm the Setup
Look for evidence that the expected direction is actually gaining momentum.
Step 6: Calculate Risk
Determine:
- Entry price
- Stop-loss
- Target
- Position size
- Risk-to-reward ratio
Step 7: Execute Without Emotional Decisions
Once the trade is placed, avoid constantly moving your stop-loss simply because the market moves against you.
A trading plan should be designed before the trade, not rewritten emotionally during it.
Final Thoughts
Candlestick patterns can be powerful tools for swing traders, but they shouldn’t be treated as standalone trading systems.
The biggest lesson is simple:
Location > Pattern > Confirmation > Risk Management.
A bullish engulfing pattern at major support is worth paying attention to. The same bullish engulfing pattern appearing directly beneath major resistance may be much less attractive.
For swing trading, focus primarily on the 4-hour and daily charts, where market structure and important price levels are easier to identify.
Start with a small group of patterns rather than trying to memorize dozens of formations. Bullish/Bearish Engulfing, Morning/Evening Star, Pin Bars/Hammers, Three Line Strike, and Piercing Line/Dark Cloud Cover provide a useful foundation for studying price action.
Most importantly, don’t judge a strategy by a handful of successful trades. Backtest the setup, record your results, understand your average risk-to-reward ratio, and evaluate performance over a meaningful sample of trades.
The goal isn’t to predict every market move.
The goal is to identify situations where the potential reward justifies the risk—and then execute the plan consistently.
Learning candlestick patterns for swing trading is only the beginning; successful execution also requires confirmation, disciplined entries, proper stop-loss placement, and controlled risk.
Financial Disclaimer
Disclaimer: This article is for educational and informational purposes only and should not be considered financial, investment, trading, or other professional advice. Candlestick patterns do not guarantee profitable trades, and past performance does not guarantee future results. Trading stocks, forex, cryptocurrencies, CFDs, and other financial instruments involves substantial risk, including the possible loss of capital. Always conduct your own research, use appropriate risk management, and consider consulting a qualified financial professional before making investment decisions.