RSI Indicator + Volume: A Smarter Confirmation Strategy
The RSI indicator volume strategy adds another layer of confirmation by checking whether trading activity supports the momentum signal.
Most traders learn one simple rule: RSI below 30 means buy, and RSI above 70 means sell.
That rule sounds neat. The market rarely is.
A stock can stay overbought while continuing higher, or remain oversold while falling further. The RSI indicator becomes much more useful when you stop treating it as a standalone buy/sell button and combine it with price action and volume.
In this guide, I’ll show you a practical RSI + volume confirmation strategy, including entry rules, exits, common mistakes, and a hypothetical chart example you can test on your own setup.
What Is the RSI Indicator and Why Add Volume?
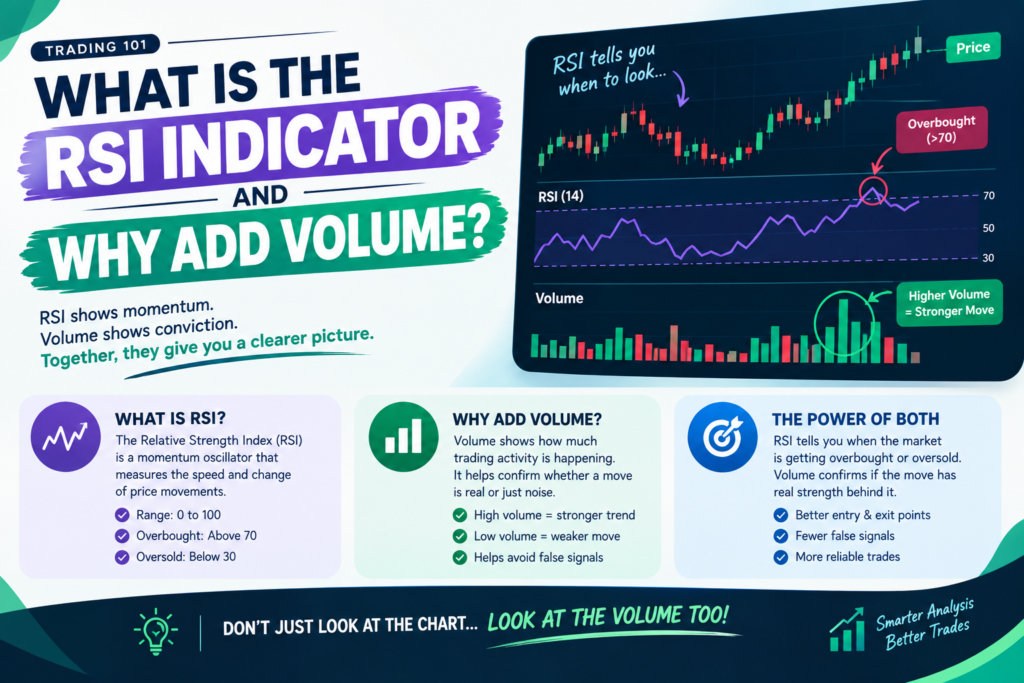
The Relative Strength Index (RSI) is a momentum oscillator that moves between 0 and 100. The traditional interpretation considers RSI above 70 overbought and below 30 oversold, although those levels should not automatically be treated as reversal signals.
The problem is simple.
RSI measures momentum. Volume measures participation.
When these two pieces of information agree, a setup can become more convincing.
For example:
- Price falls into a known support zone.
- RSI drops below 30.
- RSI then turns upward.
- Volume increases as buyers step in.
- A bullish candle closes above nearby resistance.
That tells a much better story than simply saying, “RSI is oversold, so I’m buying.”
TradingView explains that volume can help assess the strength of advances and declines, while rising volume during a breakout can provide confirmation of the move.
The basic idea
Think of the strategy like this:
RSI = momentum clue
Volume = participation confirmation
Price action = actual trigger
That third part matters.
A common mistake I see traders make is entering immediately when RSI reaches 30 or 70. In my years of trading, waiting for price to actually confirm the idea has generally produced a much cleaner decision-making process than reacting to one indicator reading.
How the RSI Indicator Volume Strategy Works
The RSI indicator volume strategy works best when RSI, volume, price action, and market structure point in the same direction.
The strategy is built around three confirmations.
1. Identify the market structure
Before looking for an entry, determine whether the market is:
- Trending upward
- Trending downward
- Moving sideways
- Sitting near major support or resistance
Why?
Because RSI behaves differently in different market conditions.
During a strong uptrend, RSI can remain above 70 for surprisingly long periods. Fidelity also notes that RSI can stay overbought or oversold for extended periods during strong trends.
So don’t automatically short simply because RSI reaches 75.
Price comes first.
2. Wait for an RSI signal
For a basic version of this strategy, use:
- RSI length: 14
- Overbought: 70
- Oversold: 30
The 14-period setting is the traditional and widely used starting point.
For a potential long setup:
- Price approaches support.
- RSI reaches or moves below 30.
- RSI begins turning upward.
- Price shows bullish reaction.
For a potential short setup:
- Price approaches resistance.
- RSI reaches or moves above 70.
- RSI begins turning downward.
- Price shows bearish reaction.
But we’re not entering yet.
For a basic version of this strategy, use RSI 14 with 70/30 levels. If you want to compare RSI 9, 14 and 21 for different trading styles, read our guide to the best RSI settings for intraday tradin
Now comes volume.
Step-by-Step RSI Indicator Volume Strategy
Step 1: Mark support and resistance
Start with the price chart and mark obvious areas where price has previously reacted. If you need a deeper explanation of how to identify these zones, see our guide to support and resistance in trading.
Mark obvious areas where price has previously reacted.
For a long trade, you’re generally more interested in RSI oversold conditions near support.
For a short trade, you’re generally more interested in RSI overbought conditions near resistance.
This prevents the classic mistake of trading every RSI signal you see.
Step 2: Add RSI
Add the RSI indicator to your chart. The RSI indicator volume strategy can start with the standard 14-period setting and 70/30 levels.
A simple starting setup is:
RSI: 14
Overbought: 70
Oversold: 30
Don’t keep changing the settings every time a trade loses.
That is usually optimization by emotion, not analysis.
Step 3: Add volume
Place the standard Volume indicator below your price chart.
You want to compare current volume with recent volume rather than looking at one volume bar in isolation.
TradingView describes volume as the amount of an asset traded during a specific period, and its recent history can help put current activity into context.
You can also use relative volume. TradingView defines relative volume as current volume divided by average volume.
Step 4: Wait for volume confirmation
For a potential long trade, look for:
This is where the RSI indicator volume strategy becomes more selective. Instead of entering immediately when RSI reaches an extreme level, wait for volume and price action to support the setup.
- RSI coming out of oversold territory
- Price holding support
- Bullish candle formation
- Volume increasing during the bullish move
For a potential short trade, look for:
- RSI falling from overbought territory
- Price rejecting resistance
- Bearish candle formation
- Volume increasing during the bearish move
The key word is confirmation.
You’re not trying to predict the exact bottom or top.
You’re waiting for evidence that the market is actually reacting.
You can strengthen the price-action part of the setup by combining RSI with a confirmation candle. See our guide on combining candlestick patterns with RSI for examples such as bullish engulfing, hammer and shooting star setups.
Step 5: Define your stop-loss before entering
A long trade could place the stop below the recent swing low or support zone.
A short trade could place the stop above the recent swing high or resistance zone.
Don’t choose your stop based on how much money you want to lose.
Choose the logical invalidation point first.
Then calculate your position size around that risk.
Step 6: Plan the exit
You can use several approaches:
- Previous resistance/support
- Fixed risk-to-reward ratio
- Trailing stop
- Price-action reversal
- RSI losing momentum
For example, if your setup has a 1:2 risk-to-reward structure, risking ₹500 would target ₹1,000 before costs and slippage.
That does not mean every trade will reach the target.
Risk management still matters more than the indicator.
A Practical RSI Indicator Volume Strategy Example
Let’s see how the RSI indicator volume strategy can be applied to a hypothetical chart without relying on RSI alone.
Imagine a stock is trading at ₹500.
It has previously reacted strongly around ₹495–₹500, creating a visible support area.
The price falls from ₹525 to ₹498.
At the same time:
- RSI falls to 27.
- Price touches the support zone.
- A bullish candle forms.
- The next candle closes above the bullish candle’s high.
- Volume rises noticeably compared with recent candles.
Now we have several pieces of information agreeing.
The setup
Entry: ₹502
Stop-loss: ₹494
Risk: ₹8 per share
Suppose your planned target is ₹518.
That’s ₹16 of potential upside for ₹8 of defined risk, giving a 1:2 risk-to-reward structure.
The important point isn’t the exact numbers.
The process is what matters:
Support → RSI oversold → bullish price reaction → volume confirmation → defined risk
Compare that with buying simply because RSI reached 27.
The second approach has much less context.
What If RSI and Volume Disagree?
When the RSI indicator volume strategy produces conflicting signals, patience is often better than forcing a trade.
This is where the strategy gets interesting.
Suppose RSI becomes oversold, but volume remains weak and price keeps making lower lows.
I would not treat that as a strong long signal.
Why?
Because momentum is weak and there isn’t convincing evidence of buying participation.
Similarly, imagine RSI reaches 72 near resistance, but price continues higher with strong volume.
Shorting immediately could be dangerous.
The market may simply be trending strongly.
This is why RSI should be treated as a context tool, not a crystal ball.
RSI + Volume vs RSI Alone
| Factor | RSI Alone | RSI + Volume |
|---|---|---|
| Measures momentum | ✅ | ✅ |
| Shows trading activity | ❌ | ✅ |
| Helps confirm breakouts | Limited | Better context |
| Helps filter weak signals | Limited | Yes |
| Requires price analysis | Yes | Yes |
| Guarantees profitable trades | ❌ | ❌ |
Volume doesn’t magically make an RSI setup profitable.
It simply gives you another piece of information.
Common Mistakes Traders Make
This becomes especially important when you’re trying to decide whether an RSI signal represents a genuine reversal or simply a temporary pullback. See our guide on pullback vs trend reversal for a deeper breakdown.
1. Buying every RSI reading below 30
Oversold doesn’t mean “price must rise now.”
A market can remain oversold while continuing lower.
Wait for price confirmation.
2. Shorting every RSI reading above 70
The same problem appears on the upside.
Strong trends can keep RSI elevated for a long time.
3. Ignoring support and resistance
An RSI signal in the middle of nowhere isn’t necessarily useful.
An RSI signal near an important price level gives you more context.
4. Treating one volume spike as proof
A large volume bar doesn’t automatically mean buyers or sellers will control the next move.
Ask what price actually did during that volume increase.
5. Using too many indicators
RSI, MACD, Stochastic, Bollinger Bands, five moving averages, three volume indicators…
At some point, your chart starts looking like an airplane cockpit.
More indicators don’t automatically mean better analysis.
If you already use MACD as a trading indicator, consider whether it is adding new information or simply repeating the momentum message RSI is already giving you.
6. Moving the stop-loss emotionally
A good setup can still fail.
That’s trading.
If the original technical reason for the trade is invalidated, accepting a controlled loss is often better than turning a small planned loss into a much larger one.
How to Improve the Strategy
Once you’re comfortable with the basic setup, you can add one additional filter.
For example:
Trend filter: 50 EMA
Then consider long setups primarily when price is above the 50 EMA and short setups primarily when price is below it.
You can also study:
- RSI divergence
- MACD confirmation
- Candlestick patterns
- Breakout and retest structures
- Support and resistance
- Relative volume
But add filters one at a time.
Otherwise, you won’t know which part of your strategy is actually helping.
TradingView’s technical-analysis resources also emphasize that indicators work from market data such as price and volume and can be combined to assess trend direction, strength and potential reversals.
You can also study RSI divergence on TradingView when price and RSI disagree, particularly around major support or resistance.
Best Timeframes for This Strategy
There isn’t one perfect timeframe.
You could test the strategy on:
- 5-minute: Scalping
- 15-minute: Intraday setups
- 1-hour: Swing-style entries
- 4-hour: Larger swing setups
- Daily: Position/swing analysis
A practical approach is to use a higher timeframe for market structure and a lower timeframe for entry timing.
For example:
1-hour: Identify trend and key levels.
15-minute: Wait for RSI + volume confirmation.
That can reduce the temptation to react to every tiny move.
External Resources
If you want to understand the indicators from primary or established educational sources, these are worth bookmarking:
- TradingView — Relative Strength Index (RSI) — RSI calculation, settings, overbought/oversold levels and divergence.
- TradingView — Volume Indicator — How volume can help assess market activity and price-move strength.
- Fidelity — RSI Guide — Practical explanation of RSI, trend behavior and divergence.
- Fidelity — Technical Analysis Guide — Overview of RSI, MACD, volume and support/resistance.
- FINRA — Investment Risk — General information about investment and market risk.
Final Thoughts
The RSI indicator with volume confirmation strategy is not about finding a magic number that tells you when to buy or sell.
It’s about combining information.
RSI tells you about momentum.
Volume tells you about participation.
Price action tells you whether the market is actually responding.
That combination can give you a more structured trading process than relying on RSI alone.
In my experience, the biggest improvement often comes from doing less: fewer impulsive entries, fewer indicator-based guesses, and more waiting for several pieces of evidence to line up.
Before using this strategy with real money, backtest it across different market conditions and record the results. A strategy that looks excellent on five charts can behave very differently across 100 trades.
Have you used RSI with volume confirmation before? What do you use as your final entry trigger? Share your approach in the comments.
Frequently Asked Questions
1. Is RSI with volume confirmation a good trading strategy?
It can be a useful framework for identifying potential setups, but it does not guarantee profitable trades. Its effectiveness depends on market conditions, execution, risk management and how the rules are tested.
2. What RSI setting should beginners use?
RSI 14 is a sensible starting point because it is the traditional default used by many charting platforms. You can later test different settings based on your trading timeframe and strategy.
3. What volume confirms an RSI buy signal?
There is no universal volume number. A stronger confirmation is generally when bullish price movement occurs with volume noticeably higher than recent normal activity, particularly around support or a breakout.
4. Can RSI stay overbought for a long time?
Yes. During strong trends, RSI can remain above 70 for an extended period. That’s why an overbought reading should not automatically be interpreted as a short signal.
Disclaimer: This article is for educational and informational purposes only. It is not financial, investment, or trading advice. Trading and investing involve the risk of loss, and past market behavior does not guarantee future results. Always conduct your own research, backtest any strategy, and consider your risk tolerance before making financial decisions.