The VWAP + CPR Crossover Strategy: 5 Rules for Nifty Intraday Success
Retail traders in the Indian stock market face a major challenge every morning at 9:15 AM. Volatility surges, fake breakouts trigger stop-losses, and noise on the 5-minute chart leads to overtrading.
If you rely on a single technical indicator, you are fighting an uphill battle against institutional algorithms.
Combining dynamic volume-weighted price action with static structural support and resistance levels changes the equation. By pairing Volume Weighted Average Price (VWAP) with the Central Pivot Range (CPR), you create a high-probability confluence system.
This guide breaks down the complete VWAP and CPR strategy tailored specifically for trading Nifty 50 and Bank Nifty index options.
What is VWAP?
“Understanding volume-weighted price action is essential before deploying the vwap and cpr strategy on live charts.”
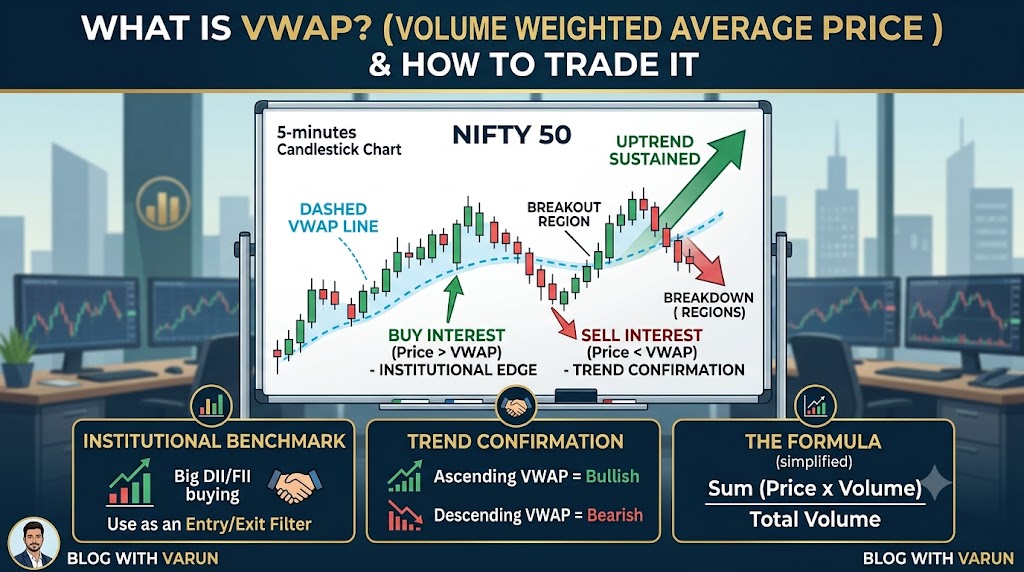
VWAP (Volume Weighted Average Price) calculates the average price an asset has traded at throughout the day, based on both volume and price.
Unlike a simple moving average, VWAP reflects institutional buying and selling interest. Big market participants—like Domestic Institutional Investors (DIIs) and Foreign Institutional Investors (FIIs)—use VWAP to benchmark their execution efficiency.
- When price trades above VWAP, buyers are in control.
- When price trades below VWAP, sellers dominate the session.
Using VWAP as a standalone tool can lead to whipsaws during range-bound sessions. To filter out false signals, you need a secondary structural overlay.
For a detailed breakdown of volume calculation, check out our [ VWAP 20 EMA Strategy for Options: 5 Rules].
What is CPR (Central Pivot Range)?
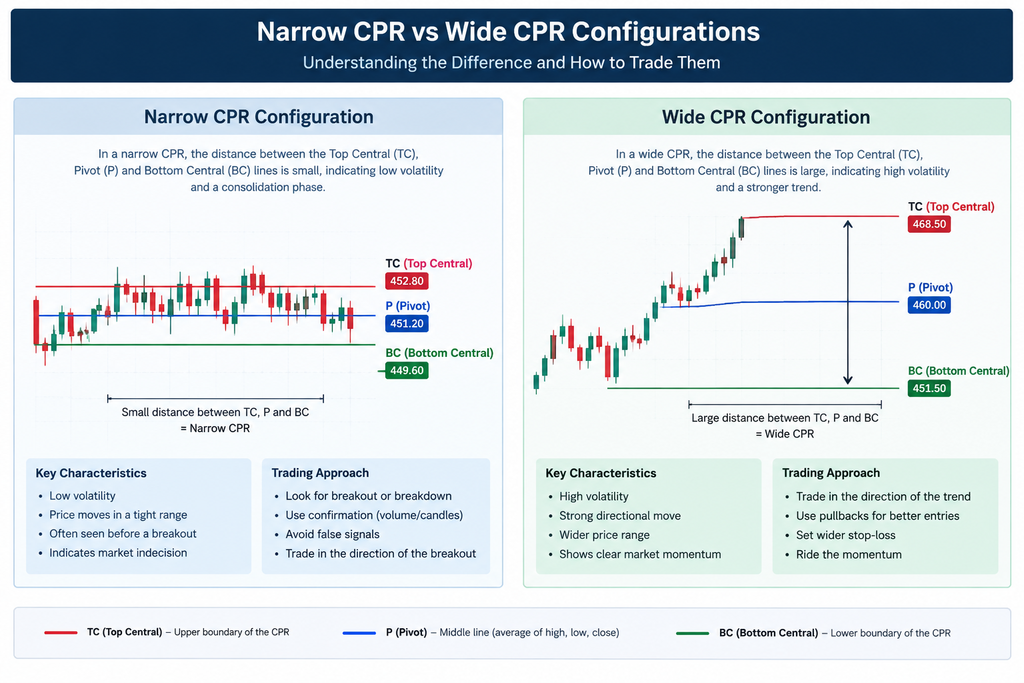
The Central Pivot Range (CPR) is a leading technical indicator derived from the high, low, and close of the previous trading day. It consists of three key levels on your charting software:
- Pivot (P): $\text{(High} + \text{Low} + \text{Close)} / 3$
- Bottom Central Pivot (BC): $(\text{High} + \text{Low}) / 2$
- Top Central Pivot (TC): $(\text{Pivot} – \text{BC}) + \text{Pivot}$
               TC (Top Central)
-----------------------------------------------
               Pivot Line (P)
-----------------------------------------------
               BC (Bottom Central)
Combining these static levels forms the structural foundation of the vwap and cpr strategy."
Key CPR Characteristics for Indian Markets
- Narrow CPR: Indicates low volatility on the previous day. It often predicts a strong trending day in Nifty 50.
- Wide CPR: Indicates high volatility on the previous day. It suggests a sideways or range-bound market structure.
- Ascending/Descending CPR: Indicates clear higher-timeframe momentum across sessions.
While CPR provides fixed support and resistance zones, it lacks real-time volume insights. Pairing CPR with real-time volume data resolves this limitation.
The VWAP + CPR Crossover Strategy Explained
The VWAP and CPR strategy leverages the strengths of both indicators: institutional volume tracking from VWAP and structural price boundaries from CPR.
       BULLISH CROSSOVER SETUP

  Price Line     /\      ---> Sustained Above CPR & VWAP
  VWAP Line   --/--\---- ---> Crossover Occurs
  CPR Zone   [==========] ---> Floor Support Hold
How the Confluence Works
- Static Meets Dynamic: CPR provides stable horizontal floors and ceilings for the session. VWAP shifts dynamically as order flow enters the market.
- Institutional Confirmation: When Nifty crosses above a narrow CPR and simultaneously holds above VWAP, institutions are aggressively accumulating contracts.
- Volatility Filter: During sideways sessions, price frequently gets trapped between VWAP and the CPR levels. Avoiding trades during these periods prevents unnecessary losses.
Exact Entry, Stop-Loss, and Target Rules
“The vwap and cpr strategy requires strict confirmation to avoid sudden short-covering rallies.”
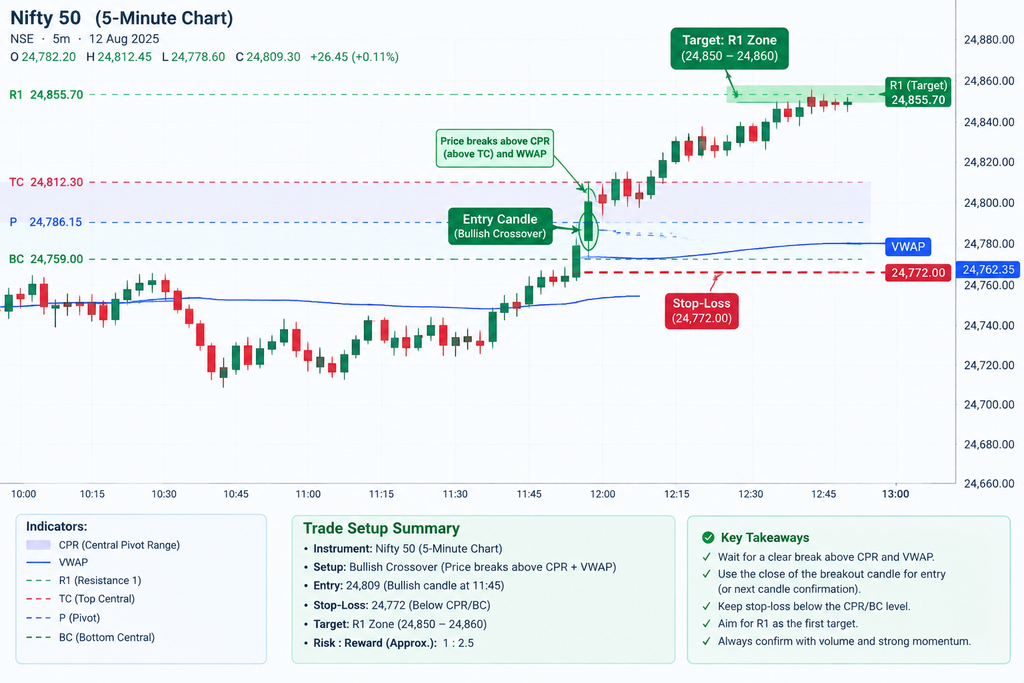
Rules-based execution is critical when trading index futures and option buying strategies on the NSE.
1. Bullish Long Setup
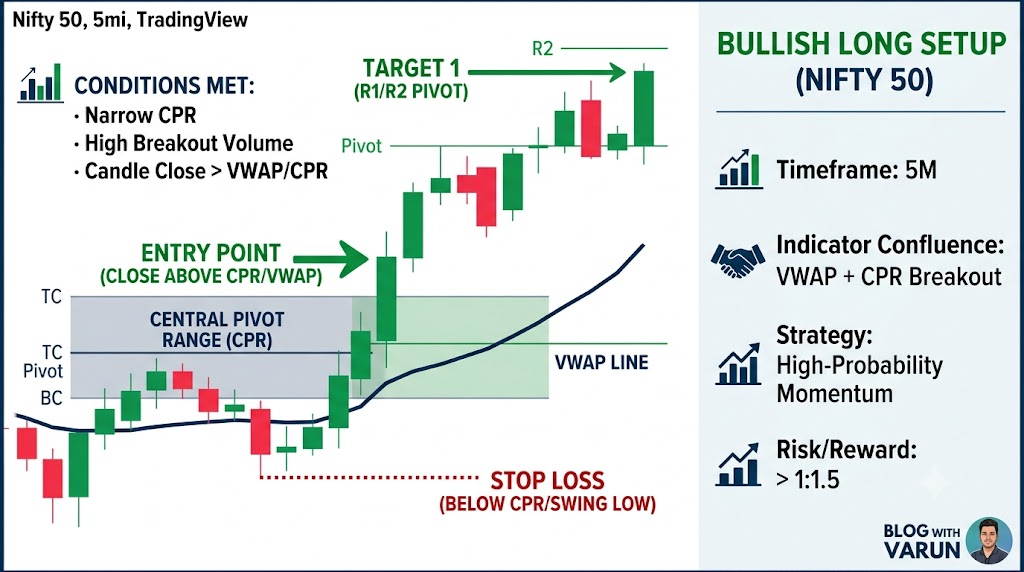
“When executing a long trade with the vwap and cpr strategy, always wait for a candle body close above the TC line.”
Conditions
- The CPR width for the day is narrow to medium.
- The 5-minute candle opens above or near the CPR and crosses above VWAP with strong volume.
- The closing price of the breakout candle is cleanly above both CPR levels and VWAP.
Execution
- Entry: Buy Nifty Futures or At-The-Money (ATM) Call Options on the close of the breakout candle (or on a light retest of VWAP).
- Stop-Loss: Set your stop-loss right below the lowest point of the CPR range or 5 points below the swing low candle.
- Target: Aim for the immediate Resistance 1 (R1) or Resistance 2 (R2) pivot levels. Maintain a minimum Risk-to-Reward (RR) ratio of 1:1.5 or 1:2.
“When executing a long trade with the vwap and cpr strategy, always wait for candle body confirmation above the TC line.”
2. Bearish Short Setup
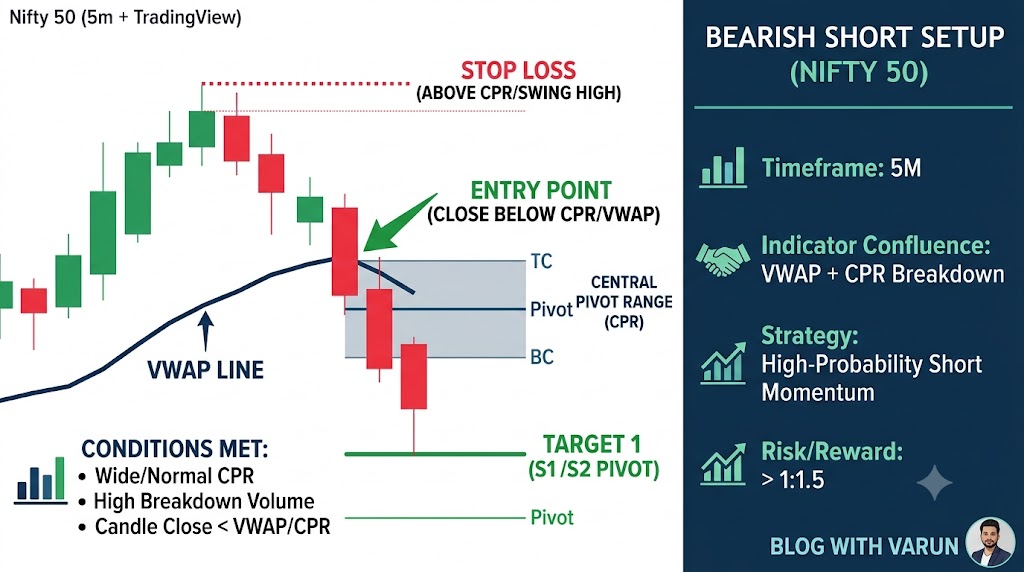
Conditions
- Price breaks down below both the CPR range and the VWAP line on the 5-minute time frame.
- The breakdown candle exhibits above-average volume bars.
- VWAP trends downward, remaining above the price line.
Execution
- Entry: Short Nifty Futures or buy ATM Put Options once the breakdown candle closes cleanly below VWAP and CPR.
- Stop-Loss: Place your stop-loss 5 points above the TC (Top Central) line or above the high of the breakdown candle.
- Target: Target Support 1 (S1) or Support 2 (S2) key levels.
How to Trade This Setup on Nifty 50
Here is a step-by-step walkthrough for configuring and executing this system on popular Indian platforms like TradingView, Zerodha Kite, or Upstox.
+-----------------------------------------------------------------------+
| TIME FRAME : 5-Minute Chart                                           |
| INSTRUMENT : Nifty 50 Index / Bank Nifty                              |
| INDICATORS : Daily VWAP + Daily CPR (Pivot Levels)                     |
+-----------------------------------------------------------------------+
Step 1: Pre-Market Preparation (8:45 AM – 9:00 AM)
- Check the global market sentiment (GIFT Nifty) to anticipate gap openings.
- Plot the Daily CPR on your charting software. Note whether today’s CPR is narrower or wider than yesterday’s range.
Step 2: Opening Phase (9:15 AM – 9:30 AM)
- Allow the initial 5-minute to 15-minute candle to complete. Avoid entering market orders immediately at 9:15 AM due to spread slippage.
- Confirm where the VWAP is plotting relative to the central pivot range.
Step 3: Trade Trigger (9:30 AM – 11:30 AM)
- Look for a clear 5-minute candle body closure across both indicators.
- Verify that the candle pattern aligns with price action momentum.
- Confirm that market data updates comply with standard market regulations established by NSE India.
“Executing the vwap and cpr strategy on 5-minute candles gives you the cleanest trade signals before noon.”
To learn more about reading price candles, refer to our Candlestick Patterns article].
Risk Management Rules for Intraday Trading
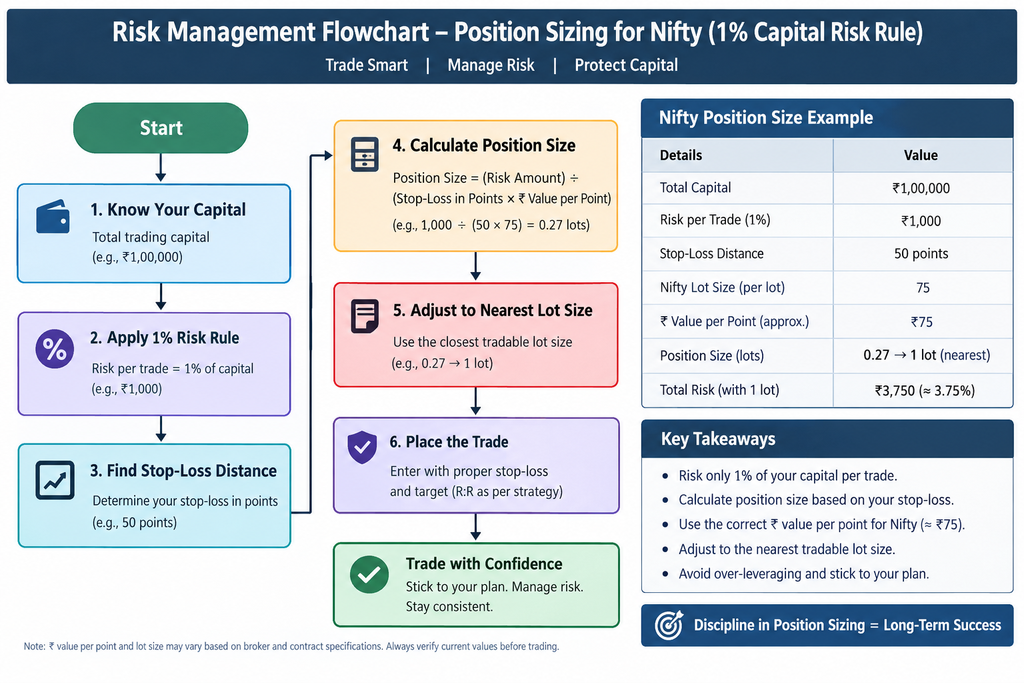
Executing a high-win-rate system like the VWAP and CPR strategy will not yield long-term profitability without strict capital preservation controls.
| Risk Rule | Guideline for Retail Traders |
| Max Capital At Risk | Never risk more than 1% to 1.5% of your total trading capital on a single intraday trade. |
| Daily Drawdown Limit | Stop trading for the session if you hit 2 consecutive stop-losses. |
| Option Buying Decay | Close intraday index options positions by 3:00 PM to avoid rapid time-decay (theta drop). |
| Position Sizing | Calculate lot size based on stop-loss points, not on leverage limits provided by brokers. |
                       TRADING CAPITAL (₹1,000,000)
                                    |
                        1% RISK PER TRADE = ₹10,000
                                    |
          +-------------------------+-------------------------+
          |                                                   |
   STOP-LOSS = 20 POINTS                             STOP-LOSS = 10 POINTS
   MAX LOTS = 10 (Nifty 500 Qty)                     MAX LOTS = 20 (Nifty 1000 Qty)
Common Mistakes to Avoid with the VWAP and CPR Strategy
- Trading inside a Wide CPR: A wide CPR acts as a major consolidation zone. Buying or selling when price is trapped within a wide CPR leads to low-momentum chop.
- Ignoring Volume Confirmation: Entering a crossover trade without an increase in relative volume often leads to bull and bear traps.
- Chasing Extended Candles: If a 5-minute breakout candle is unusually large, wait for a pull-back to VWAP before entering. Buying at the peak increases your risk exposure significantly.
- Neglecting Higher-Timeframe Context: Always check 15-minute and 1-hour charts to identify major support or resistance levels that could halt intraday momentum.
Conclusion
The VWAP and CPR strategy combines institutional volume metrics with calculated historical price levels. By taking trades only when both tools signal the same direction, you eliminate emotional noise and focus on high-probability setups.
Test this system on your platform using a demo account or small position sizing. Track every trade in a logbook, measure your win rate over 30 trades, and refine your risk management parameters accordingly.
Frequently Asked Questions (FAQ)
1.What is the best timeframe for the VWAP and CPR strategy?
The 5-minute chart is optimal for executing the vwap and cpr strategy on Nifty 50 and Bank Nifty.”
2.Can I use the VWAP and CPR strategy for option buying?
Yes. This strategy is effective for option buyers because entering near CPR breakout zones catching momentum moves offers rapid premium expansion while keeping option decay to a minimum.
3.What should I do if VWAP and CPR give conflicting signals?
When price is above VWAP but below the CPR (or vice versa), the market is in a conflict zone. Stand aside and wait for price to align on the same side of both indicators before taking a position.
4.What is the best time of day to trade the VWAP and CPR strategy?
The ideal trading window for the vwap and cpr strategy is between 9:30 AM and 11:30 AM. During these early market hours, institutional volume is at its peak, providing the strong momentum required to sustain breakout moves above or below CPR levels. Avoid taking new trade entries after 2:00 PM due to low volume and unpredictable end-of-day options squaring off.
5.Does the VWAP and CPR strategy work for Bank Nifty and stock options?
Yes. While this guide focuses on Nifty 50, the vwap and cpr strategy works equally well on highly liquid instruments like Bank Nifty, FinNifty, and high-beta F&O stocks (such as Reliance, HDFC Bank, or Tata Motors). However, because Bank Nifty exhibits higher volatility, you should widen your stop-loss distance slightly to account for larger candle wicks.
6.How do I add the CPR indicator to Zerodha or TradingView?
On TradingView, search for “Central Pivot Range” in the Indicators menu and select a community script by KGS or Pivotcall. On Zerodha Kite, open your chart settings, go to Indicators, search for “Pivot Points”, and change the type setting from Standard to CPR. Once selected, overlay the standard daily VWAP indicator alongside it.