Support and Resistance: How to Identify Key Price Levels
I’d use “support and resistance” as the primary keyword because it matches the broad informational search intent. Related keywords: support and resistance levels, support resistance trading, resistance level, support level, support and resistance strategy.
Support and Resistance in Trading are important price levels that help traders identify areas where buying or selling pressure may increase. Support generally acts as a potential floor, while resistance acts as a potential ceiling where price may struggle to move higher.
For Indian traders, understanding these levels can help with planning entries, stop-losses, targets, breakouts, and reversals. However, support and resistance should be treated as price zones rather than perfectly accurate lines.
Support and Resistance: A Practical Guide for Indian Traders
Support and resistance are price levels where a stock or index often pauses, reverses, or struggles to move further. Support acts as a potential buying area, while resistance acts as a potential selling area.
For Indian traders, understanding these levels can help with entries, stop-loss placement, profit targets, and identifying whether a breakout is worth trading. But support and resistance are zones, not perfectly accurate lines.
What Are Support and Resistance?
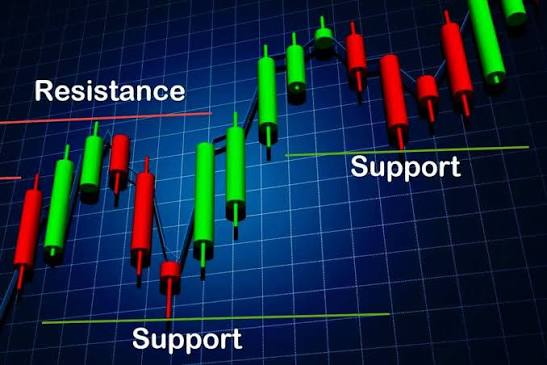
Support and resistance are areas on a price chart where buying and selling pressure has previously affected price.
- Support: A price area where buying interest may increase and prevent or slow a further decline.
- Resistance: A price area where selling pressure may increase and prevent or slow a further rise.
Think of support as a floor and resistance as a ceiling.
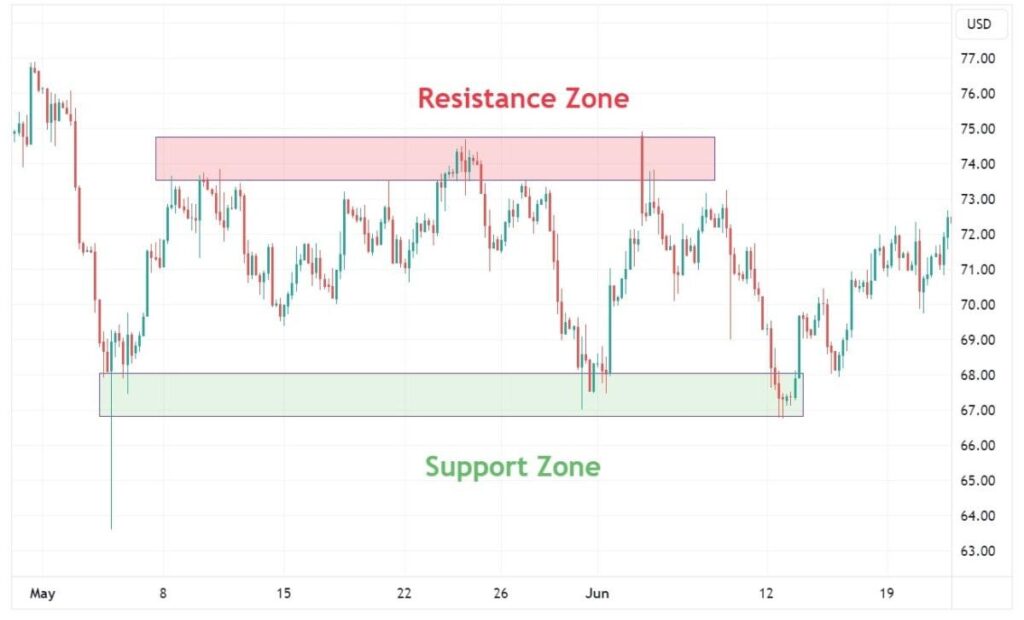
However, price does not always reverse exactly at ₹500 or ₹1,000. It may move slightly below support before recovering or move above resistance before falling back.
That is why experienced traders usually mark a zone instead of drawing one extremely precise horizontal line.
Simple Example
Suppose a stock repeatedly falls toward ₹950 and buyers appear each time.
You might mark:
Support zone: ₹945–₹955
If the stock repeatedly struggles around ₹1,000:
Resistance zone: ₹995–₹1,005
The important information isn’t that ₹950 or ₹1,000 is a magical number. The important information is that traders have repeatedly reacted around those areas.
Support and Resistance in Trading: How It Works
- “Understanding support and resistance in trading can help traders plan entries and exits.”
- “The strength of support and resistance in trading depends on several factors.”
- “When using support and resistance in trading, remember that levels are zones rather than exact prices.”
- “A common mistake when learning support and resistance in trading is entering immediately after a price touches a level.”
Support and resistance reflect the interaction between buyers and sellers.
Imagine a stock falls from ₹1,100 to ₹1,000. At ₹1,000, some traders believe the stock has become attractive and start buying. Other traders who previously bought near ₹1,000 may also defend their positions.
This increased demand can slow the decline.
The opposite can happen at resistance.
If a stock rises toward ₹1,100, traders holding profitable positions may start selling. Short sellers may also enter. New buyers may hesitate to buy at a higher price.
That creates selling pressure.
📌 Important: Support and resistance do not predict the future with certainty. They identify areas where the probability of a reaction may increase.
How to Identify Support and Resistance Levels on a Chart
You don’t need ten indicators to find important levels. Start with price itself.
1. Look for Previous Swing Lows
A swing low is an area where price declined and then moved upward.
If Nifty repeatedly finds buyers around 24,500, that area becomes worth watching as potential support.
The more meaningful reactions you see, the more attention the level deserves.
2. Look for Previous Swing Highs
A swing high is an area where price moved upward and then declined.
For example, if Bank Nifty repeatedly struggles around 54,000, that region can become a resistance zone.
3. Look for Multiple Reactions
One reaction doesn’t automatically make a level highly reliable.
A level that has produced several significant reactions can be more meaningful because the market has demonstrated interest there multiple times.
4. Check Higher Timeframes
This is one of the easiest ways beginners improve their chart analysis.
A support level visible on a daily chart can be more significant than a minor support level visible only on a 5-minute chart.
You can use:
| Trading Style | Useful Timeframes |
|---|---|
| Intraday | 15-min, 1-hour, 4-hour |
| Swing trading | 1-hour, 4-hour, Daily |
| Positional investing | Daily, Weekly |
| Long-term investing | Weekly, Monthly |
The exact combination depends on your strategy. The key is to understand the difference between a major level and short-term market noise.
Support and Resistance Can Change Roles
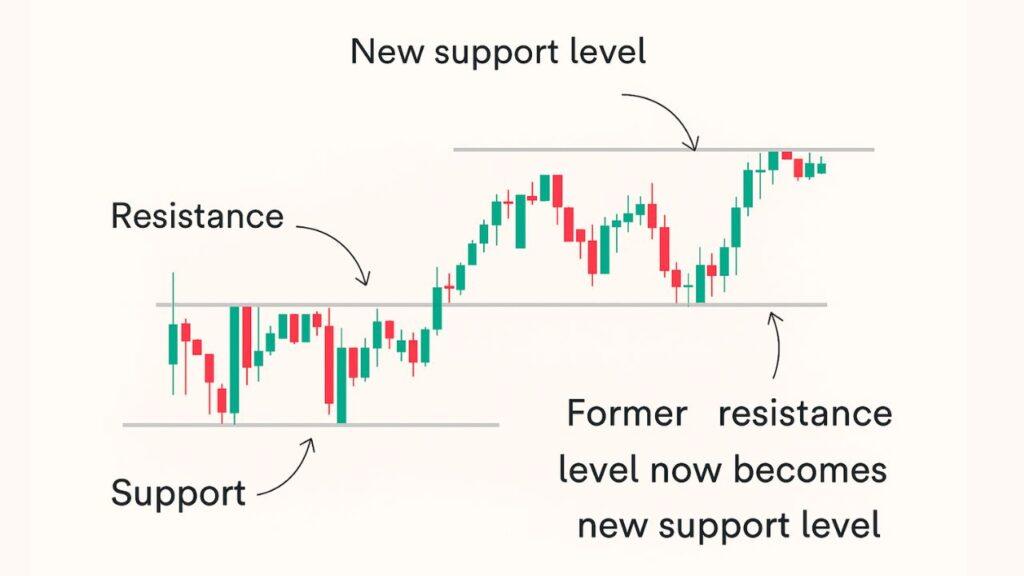
One of the most useful concepts is role reversal.
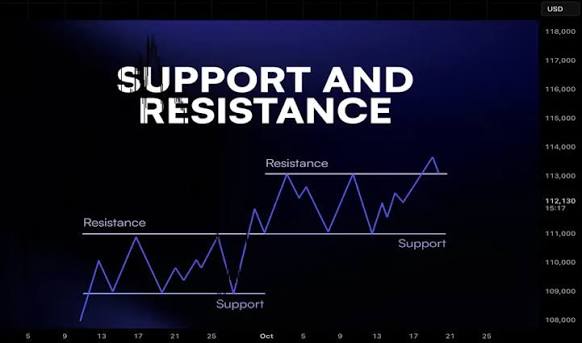
When resistance is convincingly broken, that old resistance can later become support.
Similarly, when support breaks decisively, it can later become resistance.
Example
Suppose Nifty repeatedly struggles at:
Resistance = 25,000
Nifty eventually moves above 25,000 and holds above it.
Later, Nifty falls back toward 25,000.
If buyers defend the area and price starts rising again, the previous resistance has potentially become support.
This is often called a support-resistance flip.
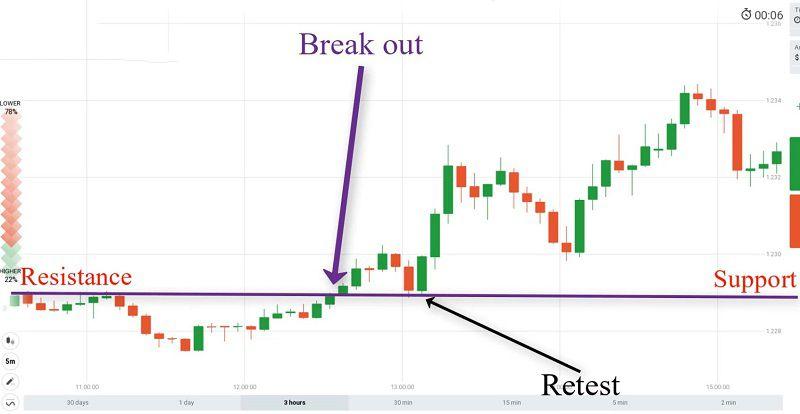
But don’t assume every breakout will produce a successful retest. Failed breakouts are common.
Support and Resistance Example Using Nifty 50
Let’s use a hypothetical Nifty example to understand the process.
Assume Nifty has been trading between:
- Support: 24,500–24,600
- Resistance: 25,000–25,100
Over several sessions, Nifty falls toward 24,550 and buyers repeatedly appear.
Later, Nifty rallies toward 25,050 and sellers push the index lower.
You now have a clearly defined range.
Scenario 1: Price Rejects Support
Nifty falls to 24,550 and forms a bullish rejection candle.
Instead of buying immediately, you could wait for confirmation such as:
- price closing back above the support zone,
- a higher low forming,
- bullish market structure,
- or confirmation from your existing strategy.
Your stop-loss should be based on the trade’s invalidation point, not simply placed at an arbitrary ₹10 or ₹20 distance.
Scenario 2: Price Breaks Resistance
Nifty moves above 25,100.
But here’s the problem:
A candle moving above resistance does not automatically mean you have a valid breakout.
If Nifty briefly reaches 25,150 and then falls back below 25,000, the breakout may have failed.
A stronger setup could involve:
Breakout → holding above resistance → retest → continuation
This is why waiting for confirmation can sometimes reduce false breakout trades.
How to Trade Support and Resistance
There isn’t one universal support and resistance strategy.
Three common approaches are:
1. Trading a Rejection
Price reaches a support or resistance zone and rejects it.
For example:
Support → bullish rejection → confirmation → long trade
or:
Resistance → bearish rejection → confirmation → short trade
The important part is not simply touching the level. You need evidence that price is actually reacting.
2. Trading a Breakout
Price moves through an important resistance or support area.
For a bullish breakout:
Resistance → breakout → confirmation → possible long
For a bearish breakout:
Support → breakdown → confirmation → possible short
Breakout traders should be particularly careful about false breakouts.
3. Trading the Retest
This is one of the cleaner ways to approach breakouts.
Example:
- Nifty breaks 25,000 resistance.
- Price moves to 25,150.
- Nifty pulls back toward 25,000.
- Buyers defend the area.
- Price starts moving higher again.
The old resistance is now acting as support.
However, a retest isn’t guaranteed. If price closes decisively below the old resistance, the setup may no longer be valid.
How to Use Support and Resistance for Stop Loss and Targets
Support and resistance can also help structure risk.
Suppose you buy a stock near a support zone at ₹950–₹960.
You don’t necessarily want your stop-loss exactly at ₹950 because normal price fluctuations can temporarily move below the zone.
Instead, your stop-loss could be placed beyond the level where your original trade idea becomes invalid, depending on volatility and your strategy.
For the target, the next major resistance could become a logical reference.
Example
Entry: ₹960
Support zone: ₹945–₹955
Potential resistance: ₹1,020
If your planned stop is ₹940:
Risk = ₹960 − ₹940 = ₹20
If your target is ₹1,020:
Potential reward = ₹1,020 − ₹960 = ₹60
That gives:
Risk-to-reward = 1:3
But don’t take the trade merely because the calculation says 1:3.
The setup still needs to make technical sense, and the probability of reaching the target matters.
The Biggest Mistake Beginners Make With Support and Resistance
The most common mistake is treating support and resistance as exact prices.
For example, a trader marks resistance at exactly ₹1,000 and thinks:
“If price reaches ₹1,000, I will short.”
But price may move to ₹1,008, ₹1,015, or even ₹1,025 before reversing.
If the trader enters too early simply because price touched ₹1,000, the position can get stopped out before the actual reversal.
Better Approach: Think in Zones
Instead of:
Resistance = ₹1,000
Think:
Resistance zone = ₹995–₹1,015
Then observe what price does inside that region.
This gives you more flexibility without changing your trading rules.
When Support and Resistance Fails
Support and resistance can fail badly during strong trends, major news events, and sudden changes in market sentiment.
Suppose Nifty has strong bullish momentum and reaches a resistance level.
A beginner might immediately short because:
“Price reached resistance.”
But strong buying can push Nifty through the level and continue higher.
The same happens with support during aggressive selling.
⚠️ A support level is not a guarantee that price will bounce.
This is particularly important around events such as:
- RBI policy decisions
- Union Budget
- major global economic data
- US Federal Reserve decisions
- major geopolitical developments
- unexpected company news
For fundamental event dates and official monetary-policy information, traders can check the Reserve Bank of India’s official website rather than relying on social-media posts.
Support and Resistance vs Trendlines
Support and resistance are usually horizontal price areas.
Trendlines are diagonal levels drawn across rising or falling swing points.
For example:
Horizontal support: ₹950
Ascending trendline: Support gradually moves from ₹900 → ₹930 → ₹960.
Both can be useful, but they describe different types of market structure.
A horizontal level can remain relevant even when the broader trend changes, while a trendline can eventually break as market conditions change.
Should You Use Indicators With Support and Resistance?
One important principle of Support and Resistance in Trading is that these levels represent areas of market interest rather than guaranteed reversal points.
You can, but indicators aren’t necessary to identify basic levels.
Price action should usually come first.
You can then use tools such as:
as additional confirmation.
For example, an intraday trader might see Nifty approaching resistance while RSI is showing overbought conditions. That can provide context, but RSI being overbought alone is not a short signal.
Likewise, price touching support isn’t automatically a buy signal.
The strongest analysis comes from combining the level with market structure, price behaviour, volume, trend and risk management.
Support and Resistance for Intraday Trading
Intraday traders need to be particularly careful with minor levels.
A 5-minute chart can contain many small highs and lows. Marking every one of them creates a chart full of lines but very little useful information.
A cleaner process is:
Step 1: Mark major levels on the 1-hour or 4-hour chart.
Step 2: Transfer the important zones to your intraday chart.
Step 3: Wait for price to approach the zone.
Step 4: Watch the reaction rather than predicting it.
Step 5: Enter only when your complete trading setup appears.
Step 6: Define your stop-loss before entering.
Step 7: Target the next logical price area.
This approach prevents support and resistance from becoming an excuse to enter every trade.
Support and Resistance Checklist
Before taking a trade around a level, ask:
- 📌 Is this level visible on a higher timeframe?
- 📌 Has price reacted here previously?
- 📌 Is it a zone rather than an overly precise line?
- 📌 What is the current market trend?
- 📌 Is price rejecting, breaking, or retesting the level?
- 📌 Is there strong momentum against my setup?
- 📌 Where is my trade invalidated?
- 📌 Is the potential reward worth the risk?
- ⚠️ Is major economic or company news approaching?
If you cannot answer these questions, you may not have enough information for the trade.
Frequently Asked Questions About Support and Resistance

Is Support and Resistance in Trading suitable for beginners?
Is support always a buying level?
No. Support is an area where buyers may appear, but it can break. Wait for your trading setup and confirmation rather than buying simply because price reaches support.
Is resistance always a selling level?
No. Strong bullish momentum can push price through resistance. A resistance level should be treated as an area to observe, not an automatic short signal.
Which timeframe is best for support and resistance?
There is no single best timeframe. Higher-timeframe levels generally carry more significance, while lower timeframes help with precise trade execution.
Can support become resistance?
Yes. After a decisive breakdown, an old support zone can become resistance. This is known as a support-resistance flip.
How many support and resistance levels should I mark?
Avoid covering your chart with lines. Focus on the most relevant zones that have produced meaningful price reactions, especially those visible on higher timeframes.
Final Takeaway
Support and resistance are not prediction tools—they are decision-making areas.
The real skill is not drawing hundreds of horizontal lines. It is identifying the levels that matter, watching how price behaves around them, and combining that information with market structure and disciplined risk management.
For your next chart analysis, start with just three things:
1. Mark the nearest major support.
2. Mark the nearest major resistance.
3. Wait to see whether price rejects, breaks, or retests the zone before considering a trade.
That simple process is far more useful than treating every support or resistance touch as a guaranteed reversal.