Pullback vs Trend Reversal: How to Tell the Difference
Understanding pullback vs trend reversal becomes easier when you focus on market structure rather than trying to predict every price movement.
A pullback vs trend reversal can look almost identical on a price chart, but the trading decision can be completely different. A pullback is usually a temporary move against the existing trend, while a trend reversal means the market may be changing direction.
The difficult part is that you cannot know with 100% certainty at the first opposite candle. Traders need to study market structure, momentum, support and resistance, volume, and confirmation before deciding whether the move is simply a pullback or a genuine reversal.
What Is a Pullback in Trading?
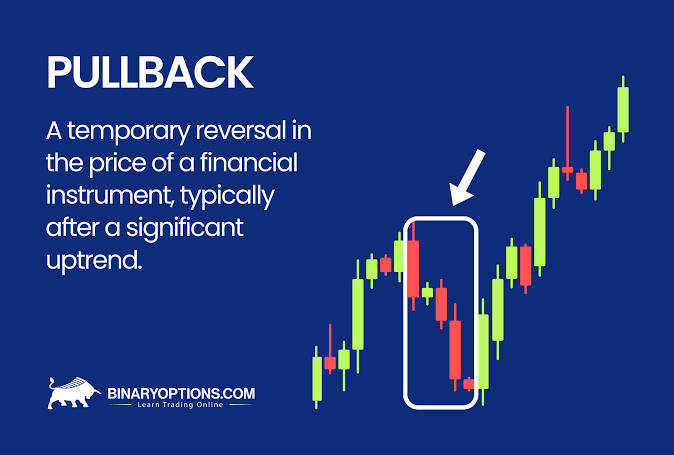
A pullback is a temporary move against the current market trend.
For example, suppose Nifty 50 is moving upward:
22,000 → 22,150 → 22,300 → 22,450
After reaching 22,450, Nifty falls to 22,350. If buyers step in around this area and price starts moving higher again, the decline is a pullback rather than a trend reversal.
The larger bullish structure remains intact.
A typical bullish trend creates:
Higher High → Higher Low → Higher High → Higher Low
A pullback often creates the next higher low.
The pullback vs trend reversal distinction is important because a temporary correction does not necessarily mean the underlying trend has changed.
Why Do Pullbacks Happen?
Markets rarely move in a straight line. Even strong trends experience temporary profit booking and periods where buyers or sellers reassess their positions.
Common reasons include:
- Traders booking partial profits
- Price reaching a short-term resistance area
- Temporary weakness in market momentum
- News or economic data
- Large traders entering at better prices
- Normal market volatility
A pullback is therefore not automatically a bearish signal in an uptrend.
Sometimes it is simply the market taking a pause before continuing in the original direction.
What Is a Trend Reversal?

A trend reversal occurs when the existing trend loses its structure and the market begins establishing a new direction.
For example:
Uptrend:
Higher High → Higher Low → Higher High
Then price breaks an important higher low and starts creating:
Lower Low → Lower High → Lower Low
That is much more significant than a normal pullback.
In a bearish reversal, the opposite happens. A downtrend stops producing lower lows and begins creating higher highs and higher lows.
The key idea is simple:
A pullback temporarily moves against the trend. A reversal changes the trend itself.
Pullback vs Trend Reversal: Key Differences
Understanding the pullback vs trend reversal distinction becomes easier when you compare market structure and price behaviour.
| Factor | Pullback | Trend Reversal |
|---|---|---|
| Main direction | Temporary move against trend | New direction may develop |
| Market structure | Usually remains intact | Existing structure gets broken |
| Higher lows in uptrend | Generally maintained | Important higher low may break |
| Momentum | Temporary weakness | Sustained momentum in opposite direction |
| Support/resistance | Often respects key levels | May break important levels |
| Volume | Can remain moderate | Strong participation may appear |
| Trend continuation | More likely | Less likely |
| Trading approach | Look for continuation setup | Wait for reversal confirmation |
This distinction matters because entering a continuation trade during a genuine reversal can result in a quick stop-loss.
How to Identify a Pullback
There is no single indicator that can tell you, with certainty, whether a move is a pullback.
Experienced traders usually combine several pieces of information.
When analysing pullback vs trend reversal, start by checking whether the previous swing structure is still intact.
1. Check the Market Structure
Market structure should be your first filter.
Imagine Bank Nifty is in a strong uptrend:
- Higher high at 51,000
- Higher low at 50,600
- Higher high at 51,400
- Higher low at 50,950
Now price falls from 51,400 to 51,100.
That decline alone doesn’t mean the trend has reversed.
The important question is:
Has the previous important higher low been broken?
If 50,950 continues to hold and buyers return, the bearish move may simply be a pullback.
If price decisively breaks 50,950 and begins forming lower highs and lower lows, the situation becomes more serious.
2. Look at Important Support and Resistance
Pullbacks frequently stop around areas where buyers or sellers previously showed interest.
These can include:
- Previous swing highs
- Previous swing lows
- Support and resistance zones
- Moving averages
- Breakout levels
- Demand and supply areas
- Fibonacci retracement zones
For example, if Nifty breaks above 22,000 and later returns to 22,000 before moving higher, that level can become an important area to watch.
But don’t assume every retest will hold.
A level is an area of interest, not a guaranteed reversal point.
Before judging whether a move is a pullback, it helps to understand how support and resistance in trading can influence price reactions.
3. Study Momentum
Momentum can help determine whether the opposite move is gaining strength.
Suppose Nifty rises strongly and then produces three small bearish candles with decreasing momentum. That behaviour is different from a sharp sell-off with large bearish candles.
Momentum indicators such as RSI or MACD can provide additional information, but they should not be used alone.
A market can remain overbought for a long time during a strong uptrend.
Overbought does not automatically mean reversal.
Understanding market structure in trading can help you identify whether price is still creating higher highs and higher lows or has started forming a new structure.
How to Confirm a Trend Reversal
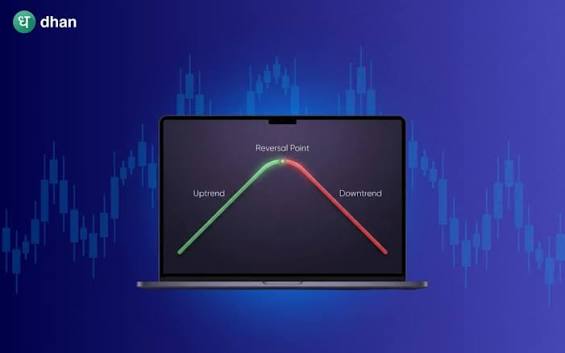
A reversal should generally require more evidence than a simple opposite candle.
This is where pullback vs trend reversal becomes clearer: a genuine reversal usually damages the existing market structure.
Break of Market Structure
This is one of the most important clues.
Suppose an uptrend has an important higher low at 22,200.
If price falls below 22,200 and cannot reclaim it, the bullish structure has weakened.
A break followed by a lower high provides stronger evidence that sellers are gaining control.
Change in Character
You may notice that price behaviour changes.
Previously:
- Buyers quickly defended dips
- Bullish candles were strong
- Pullbacks were shallow
- New highs appeared regularly
Then suddenly:
- Selling becomes aggressive
- Previous support breaks
- Bounces become weaker
- Lower highs start appearing
That behavioural change is more meaningful than one red candle.
Volume Confirmation
Volume can add context.
If price breaks an important support level with significantly higher volume, the move deserves more attention than a low-volume temporary dip.
However, volume should not be treated as standalone confirmation. A high-volume move can still fail.
Retest of the Broken Level
One of the cleaner reversal patterns is:
Support breaks → Price falls → Price retests broken support → Sellers reject price → Downtrend continues
For an uptrend turning bearish, this type of retest can provide stronger evidence than immediately selling the first breakdown candle.
Worked Example: Pullback or Reversal on Nifty 50?
Consider a hypothetical Nifty 50 setup.
Nifty moves:
21,800 → 22,000 → 22,250 → 22,500
The market is clearly showing bullish structure.
The latest important higher low is around 22,250.
Nifty then falls from 22,500 to 22,350.
For official Nifty 50 index information and market data, you can refer to the [NSE India Nifty 50 page].
Scenario 1: Pullback

Price reaches 22,350 and buyers appear.
Nifty moves:
22,500 → 22,350 → 22,420 → 22,550
The previous higher low around 22,250 remains untouched.
The market has continued producing higher highs and higher lows.
This is consistent with a pullback.
A trader looking for a continuation setup could wait for bullish price action around a meaningful support zone rather than blindly buying the first dip.
Scenario 2: Trend Reversal
Now imagine a different sequence:
22,500 → 22,350 → 22,200 → 22,050
The previous important higher low around 22,250 has been broken.
Nifty then rebounds to 22,250 but fails to move above 22,300 and falls again to 22,000.
Now the structure looks more like:
Higher High → Structure Break → Lower High → Lower Low
That is much stronger evidence of a potential bearish reversal.
Notice the difference.
The first scenario only showed weakness.
The second scenario showed structural damage followed by continued selling.
The Biggest Mistake Beginners Make
One of the most common mistakes is treating every market correction as a reversal.
A trader sees Nifty fall 100 points after a strong rally and immediately thinks:
“The trend is over.”
They short the market.
Then Nifty finds support and rallies another 300 points.
The opposite mistake is equally dangerous.
A trader sees a market that has already broken important support and says:
“It’s just a pullback.”
They continue buying dips while the market is actually transitioning into a downtrend.
The solution is to stop predicting and start evaluating evidence.
Ask:
- What is the current higher-timeframe trend?
- Where is the most recent important swing high/low?
- Has market structure actually broken?
- Is price respecting or breaking important support?
- Is momentum increasing in the opposite direction?
- Has the market created a lower high or higher low?
- Is there confirmation on my trading timeframe?
This process is far more useful than trying to identify the exact reversal candle.
Pullback Trading vs Reversal Trading
Knowing pullback vs trend reversal can help traders choose between a trend-continuation setup and a potential reversal setup.
These are two different trading approaches.
Pullback Trading
The trader assumes the existing trend is still valid.
For an uptrend, the basic idea is:
Uptrend → Pullback → Support → Bullish confirmation → Continuation
For a downtrend:
Downtrend → Pullback → Resistance → Bearish confirmation → Continuation
The goal is to enter in the direction of the larger trend after a temporary correction.
Reversal Trading
Here the trader is attempting to participate when the existing trend changes.
A basic bearish reversal sequence could be:
Uptrend → Important support breaks → Lower high → Bearish continuation
This can offer good opportunities, but it is usually harder because the trader is trying to identify a transition rather than simply trade with an established trend.
Can Indicators Tell You If It Is a Pullback or Reversal?
Indicators can help, but they cannot make the decision for you.
Moving Averages
A 20 EMA or 50 EMA can help you understand trend direction and dynamic areas of support/resistance.
But price crossing a moving average once doesn’t automatically confirm a reversal.
RSI
RSI can show momentum conditions and potential divergence.
But an RSI reading below 30 does not guarantee that price will reverse upward, just as an RSI above 70 does not guarantee a bearish reversal.
If you use RSI for momentum analysis, read our guide on how the RSI indicator works to understand why overbought and oversold readings should not be treated as automatic reversal signals.
MACD
MACD can help identify changes in momentum.
It becomes more useful when combined with price structure rather than used as a standalone buy/sell signal.
📌 Best practice: Use indicators as supporting evidence. Let price structure remain the primary information.
When the Pullback vs Trend Reversal Method Fails
There are situations where even experienced traders get this wrong.
The biggest problem is that a pullback can turn into a reversal.
For example, Nifty may initially fall only 0.5% from its high. At that point, the move looks completely normal.
Then negative news appears.
Selling accelerates, support breaks, and the market begins forming lower highs and lower lows.
What looked like a pullback at 22,300 can eventually become the beginning of a larger reversal.
This is why traders should avoid statements such as:
“It definitely has to bounce here.”
Markets don’t have to respect your analysis.
Instead, define the level where your original idea becomes invalid.
For example:
“I will consider this a bullish continuation setup only while the previous important higher low remains intact.”
That gives you a clear invalidation point.
How to Trade Pullbacks Without Confusing Them With Reversals
A practical approach is to use multiple timeframes.
For example, if you are trading Nifty intraday:
1-hour chart: Identify the broader trend.
15-minute chart: Identify important structure and support/resistance.
5-minute chart: Wait for the actual entry confirmation.
This prevents a common problem where a trader sees a bearish candle on the 5-minute chart and assumes the entire market has reversed.
A bearish move on a lower timeframe can simply be a pullback within a bullish higher-timeframe trend.
Technical analysis can help structure a trading plan, but it does not eliminate market risk. Investors should also understand the risks of securities-market trading through [SEBI’s investor education resources].
A Simple Decision Framework
Before taking a continuation trade, ask:
Step 1: Is the higher-timeframe trend clear?
Step 2: Has the important swing structure remained intact?
Step 3: Has price reached a meaningful support/resistance area?
Step 4: Is there confirmation of buyers or sellers returning?
Step 5: Where is the invalidation point?
Step 6: Does the potential reward justify the risk?
If several answers are unclear, there may be no trade.
Sometimes the best decision is to wait.

Pullback vs Trend Reversal: Quick Checklist
Use this checklist before entering a trade:
Signs of a Pullback
- Existing trend remains intact
- Important swing level holds
- Price approaches a support/resistance area
- Momentum against the trend appears temporary
- Trend continuation structure develops
- Buyers/sellers return at a key level
Signs of a Possible Reversal
- Important swing level breaks
- Price fails to reclaim the broken level
- Lower highs appear after an uptrend
- Higher lows appear after a downtrend
- Opposite-side momentum becomes stronger
- Support turns into resistance or resistance turns into support
⚠️ None of these signals provides certainty. They increase or decrease the probability of one scenario compared with the other.
A consistent pullback vs trend reversal analysis should therefore combine market structure, key levels, momentum and confirmation.
Final Takeaway
The easiest way to remember the pullback vs trend reversal difference is this:
A pullback changes price direction temporarily. A reversal changes market structure.
Don’t call every red candle a reversal, and don’t call every dip a buying opportunity.
Start with the higher-timeframe trend, mark the important swing high and swing low, and then watch what happens when price reaches those levels. If the existing structure holds, a pullback is more likely. If important structure breaks and the market starts building a new sequence of highs and lows, the probability of a reversal increases.
For additional information about investing and trading in India, readers can also refer to [NSE’s investor education resources].
Recommended Next Action
Open a Nifty 50 chart and review the last 20–30 major swings. For each one, mark whether the opposite move was ultimately a pullback or a reversal.
Don’t just mark the answer. Write down why:
- Did structure hold?
- Which level broke?
- Did the market create a new higher low or lower high?
- Did the broken level get retested?
- What happened afterward?
This exercise will teach you far more about pullback trading and trend reversal than memorising another indicator signal.