How to Use RSI in a Sideways Market: A Practical Strategy
Learning how to use RSI in sideways market conditions can help traders avoid entering trades based on weak momentum signals.
Understanding RSI in sideways market conditions can help traders avoid taking signals blindly when price is moving inside a range.
Most traders learn one RSI rule and then immediately try to trade it:
RSI below 30 = Buy. RSI above 70 = Sell.
Sounds simple, right?
Not really.
In a sideways market, RSI can actually become much more useful—but only if you stop treating every overbought or oversold reading as a trade signal. The real opportunity comes from combining RSI in sideways market conditions with support, resistance, price action, and sensible risk management.
In my years of trading, one mistake I see repeatedly is traders buying simply because RSI touches 30, then watching price fall another 1–2%. The indicator wasn’t necessarily wrong. The trader was simply asking it to do a job it wasn’t designed to do alone.
So, how should you actually use RSI when price is moving inside a range?
Let’s break it down.
Why RSI in Sideways Market Conditions Is Different
The Relative Strength Index (RSI) is a momentum oscillator that moves between 0 and 100. The traditional interpretation considers readings above 70 overbought and readings below 30 oversold. RSI is commonly set to 14 periods.
But here’s the interesting part.
RSI behaves differently depending on the market environment.
During a strong trend, RSI can remain overbought or oversold for a surprisingly long time. That means selling simply because RSI reaches 70 can be a painful experience during a strong uptrend.
A sideways market is different.
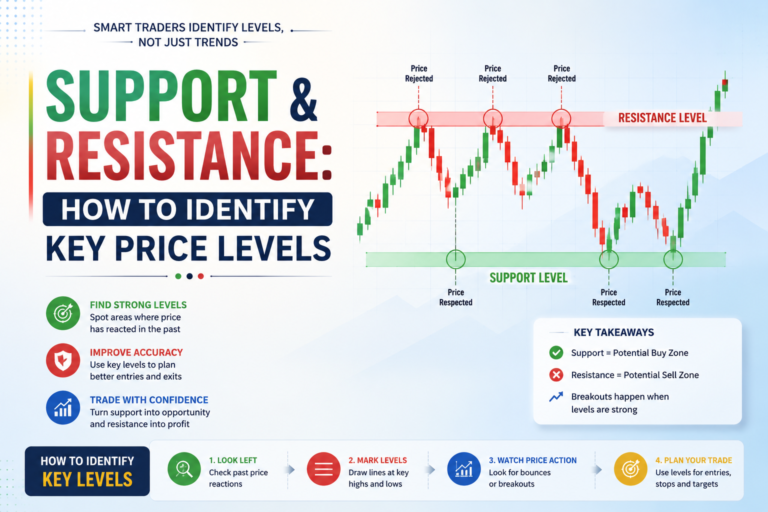
Price repeatedly moves between relatively clear areas of support and resistance instead of making sustained higher highs or lower lows.
Think of it like a ball bouncing between two walls.
Resistance → Price falls → Support → Price rises → Resistance
This repeated movement is where RSI can become particularly useful.
What Does a Sideways Market Look Like?
Before using RSI, first identify whether the market is actually ranging.
Typical characteristics include:
- Price repeatedly respects a similar support zone.
- Price repeatedly struggles near resistance.
- Higher highs and lower lows are not developing consistently.
- Breakouts frequently fail.
- RSI frequently moves back and forth around 50.
- Volatility may contract compared with a strong directional move.
For example:
| Market Condition | Price Behaviour | RSI Behaviour | RSI Approach |
|---|---|---|---|
| Strong uptrend | Higher highs | Often stays above 50 | Avoid blindly selling 70+ |
| Strong downtrend | Lower lows | Often stays below 50 | Avoid blindly buying below 30 |
| Sideways range | Bounces between S/R | Oscillates frequently | Look for range reversals |
| Breakout | Leaves the range | Momentum expands | Reassess the setup |
TradingView also describes RSI as a 0–100 momentum oscillator and notes that the 50 area can represent a neutral/no-trend condition.
That gives us our first major rule:
Don’t start with RSI. Start by identifying the market structure.
How to Use RSI in a Sideways Market
The basic idea is simple:
Buy closer to support when RSI shows weakening bearish momentum.
Consider selling closer to resistance when RSI shows weakening bullish momentum.
Notice the wording.
Not “buy every RSI 30.”
Not “sell every RSI 70.”
The location of price matters.
1. Find the Trading Range First
Open your chart and identify the obvious range.
For example:
Resistance: $105
Support: $100
If price has tested the $100–$105 region several times without establishing a sustained breakout, you may have a range.
Now add RSI.
A standard RSI 14 is a reasonable starting point. TradingView identifies 14 as the popular/default RSI period, although traders can use different settings depending on their strategy.
Don’t immediately change the settings to RSI 7 because you want more signals.
More signals do not automatically mean better signals.
2. Watch RSI Near Support
Suppose price drops toward your previously identified support zone.
At the same time, RSI moves toward 30.
That gets interesting.
But you still don’t automatically enter.
Instead, look for evidence that sellers are losing control.
For example:
- Price reaches support.
- RSI falls below 30.
- Price stops making aggressive new lows.
- RSI moves back above 30.
- A bullish candle forms around support.
- The next candle confirms the rejection.
Now the setup has several pieces working together.
Support + RSI + Price Action
That’s considerably different from:
RSI = 29 → BUY
3. Watch RSI Near Resistance
The opposite setup can occur at the upper boundary.
Imagine price reaches resistance while RSI moves above 70.
Again, don’t automatically short.
Wait.
Look for signs such as:
- Price reaches resistance.
- RSI enters the overbought area.
- Price fails to continue higher.
- RSI turns downward.
- A bearish rejection candle appears.
- Price begins moving back inside the range.
This gives you a potential short setup.
The key is that RSI is confirming the location of price rather than replacing market structure.
The RSI Sideways Market Strategy
When using RSI in sideways market conditions, combine RSI signals with established support and resistance zones.
The best way to use RSI in sideways market conditions is to combine the indicator with clear support and resistance levels.
Here’s a practical framework you can test on historical charts.
Step 1: Identify Support and Resistance
Mark at least two clear reaction zones.
You don’t need to draw 15 lines across your chart.
Keep it clean.
Look for areas where price has previously reversed multiple times.
Step 2: Confirm the Market Is Actually Sideways
Ask:
- Is price making consistent higher highs?
- Is price making consistent lower lows?
- Are breakouts being sustained?
- Or is price repeatedly returning to the same area?
If price is strongly trending, this strategy becomes less suitable.
Step 3: Add RSI 14
Start with the standard RSI 14.
Use the traditional:
70 = overbought
30 = oversold
50 = midpoint/neutral area
These aren’t magical numbers. They are reference levels.
Step 4: Wait for Price to Reach the Range Boundary
This is where many traders get impatient.
If price is sitting in the middle of the range, there may be no attractive setup.
For example:
Support = $100
Resistance = $110
If price is around $105, the risk/reward may not be particularly attractive for a range trade.
Wait for price to approach one of the boundaries.
Step 5: Look for RSI Confirmation
Near support:
RSI < 30 → RSI recovers above 30
Near resistance:
RSI > 70 → RSI falls back below 70
The cross back can be more useful than simply touching the extreme.
TradingView’s RSI strategy documentation similarly describes entries around RSI crossing back through the oversold/overbought thresholds rather than treating the raw level alone as the entire signal.
Step 6: Add Price Action
This is where the setup becomes much more interesting.
At support, look for:
- Bullish engulfing candle
- Hammer
- Strong rejection wick
- Higher low
- Break of a minor swing high
At resistance, look for:
- Bearish engulfing candle
- Shooting star
- Rejection wick
- Lower high
- Break of a minor swing low
You don’t need every confirmation.
One or two clean confirmations can be enough for a testable trading plan.
Step 7: Define Your Stop-Loss Before Entry
This part isn’t exciting.
It’s also the part that protects your account.
For a long setup near support, a logical invalidation point may sit below the support structure.
For a short setup near resistance, the invalidation point may sit above the resistance structure.
Don’t place your stop at an arbitrary number simply because you want a particular position size.
Structure first. Position size second.
Step 8: Target the Opposite Side of the Range
A common range-trading concept is:
Support → Long → Target resistance
and
Resistance → Short → Target support
But don’t assume price will always travel across the entire range.
Consider taking partial profits, moving the stop according to your tested rules, or exiting when the original setup is invalidated.
Your backtest should determine what actually makes sense.
RSI in Sideways Market: 30/70 Isn’t the Whole Story
In RSI in sideways market setups, the traditional 70 and 30 levels can become more useful because price repeatedly moves between range boundaries.
Here’s where things get interesting.
Many beginners assume:
RSI > 70 = Sell
RSI < 30 = Buy
But RSI doesn’t work that mechanically.
Fidelity specifically warns that RSI can remain overbought or oversold for extended periods during strong trends.
So imagine this:
Price is trending strongly upward.
RSI reaches 72.
You short.
Price continues upward.
RSI reaches 76.
You add another short.
Price reaches a new high.
Now your problem isn’t RSI.
Your problem is that you ignored the trend.
This is why the same RSI reading can mean different things in different market conditions.
A Better Way: Use RSI With Support and Resistance
Consider two scenarios.
Scenario A: RSI 25 in the Middle of a Downtrend
Price is aggressively falling.
There is no obvious support nearby.
RSI hits 25.
Should you buy?
Not necessarily.
Price can remain oversold while the trend continues.
Scenario B: RSI 25 at Major Support
Now imagine:
- Price reaches established support.
- RSI falls to 25.
- Price forms a rejection wick.
- RSI starts moving back above 30.
- The next candle confirms the rejection.
That’s a completely different setup.
The RSI number is the same.
The context is not.
Context beats the indicator.
RSI 50 Can Be Surprisingly Useful
Most traders focus heavily on 30 and 70.
Don’t ignore 50.
When price is moving sideways, RSI can repeatedly cross the 50 level as momentum shifts between buyers and sellers. TradingView describes RSI around 50 as an indication of a neutral/no-trend condition.
You can use this information as a secondary confirmation.
For example:
Long setup
Support → RSI below 30 → RSI recovers → RSI moves toward 50
The move toward 50 can suggest that bearish momentum is fading.
Similarly:
Short setup
Resistance → RSI above 70 → RSI falls → RSI moves toward 50
This can indicate that bullish momentum is weakening.
Don’t treat the 50 cross as a standalone entry signal.
Use it as context.
RSI Divergence in a Sideways Market
Divergence can add another layer.
Bullish RSI Divergence
Price makes a lower low.
RSI makes a higher low.
That means price has weakened further, but momentum has not weakened to the same degree.
This can sometimes warn that downside momentum is fading. TradingView identifies this price/RSI disagreement as bullish divergence.
Bearish RSI Divergence
Price makes a higher high.
RSI makes a lower high.
Price pushed higher.
Momentum didn’t fully follow.
Near resistance, that can be useful information.
But divergence isn’t a guaranteed reversal signal.
It is evidence.
Treat it that way.
RSI + Support and Resistance + Price Action
If I were building a simple RSI range-trading checklist, I’d keep it this clean:
Long Setup 📈
1. Market: Sideways
2. Location: Price near support
3. RSI: Near/below 30
4. Confirmation: RSI moves back above 30
5. Price action: Bullish rejection
6. Stop: Below logical support/invalidation
7. Target: Range midpoint or resistance
Short Setup 📉
1. Market: Sideways
2. Location: Price near resistance
3. RSI: Near/above 70
4. Confirmation: RSI moves back below 70
5. Price action: Bearish rejection
6. Stop: Above logical resistance/invalidation
7. Target: Range midpoint or support
This isn’t a promise of profitability.
It’s simply a structured framework you can backtest instead of entering trades based on one indicator reading.
RSI vs MACD in a Sideways Market
RSI and MACD are both popular momentum tools, but they behave differently.
| Feature | RSI | MACD |
|---|---|---|
| Type | Momentum oscillator | Trend/momentum indicator |
| Range | 0–100 | No fixed upper/lower range |
| Overbought/Oversold | Yes | Not traditionally |
| Useful in ranges | Often useful | Can produce more whipsaws |
| Divergence | Yes | Yes |
| Key reference | 30 / 50 / 70 | Signal line / zero line |
| Best use here | Range momentum | Secondary confirmation |
MACD can still help, but I wouldn’t overload a sideways chart with five indicators.
If RSI, MACD, Bollinger Bands, Stochastic, moving averages, volume indicators and three candle patterns are all telling you different things, you’ve created a committee.
And committees rarely make charts clearer.
For additional context, Fidelity describes MACD as a tool for comparing moving averages and assessing momentum changes.
Practical Example: RSI Range Trade
This is a practical example of RSI in sideways market trading rather than relying on RSI alone.
Let’s use a hypothetical EUR/USD example.
Suppose EUR/USD has been moving between:
Support: 1.0800
Resistance: 1.0900
Price has tested both areas multiple times.
That gives us a potential range.
The Setup
Price falls from 1.0880 toward 1.0800.
RSI drops:
45 → 35 → 28
At 1.0800, price produces a long lower wick.
But instead of buying immediately at RSI 28, we wait.
The next candle closes bullish.
RSI rises back above 30.
Now we have:
- Range structure ✅
- Price at support ✅
- RSI oversold ✅
- RSI recovery above 30 ✅
- Bullish rejection ✅
That’s a much more structured setup.
Where Could the Trade Be Invalidated?
If price breaks decisively below the support area and the original range thesis is no longer valid, the trade idea needs to be reconsidered.
The stop-loss should be based on your predefined invalidation level—not adjusted emotionally because you “feel” price will come back.
Where Could You Take Profit?
A trader could define:
Target 1: Range midpoint
Target 2: Near resistance
The exact approach should depend on your risk/reward rules and historical testing.
Again, this is a hypothetical example—not a trade recommendation.
When RSI Fails in a Sideways Market
Yes, it happens.
A range can suddenly stop behaving like a range.
Imagine price has bounced between $100 and $110 for weeks.
Then an unexpected fundamental event occurs.
Price breaks $110.
RSI jumps from 65 to 78.
A trader sees 78 and immediately shorts.
Price keeps climbing.
Why?
Because the market isn’t ranging anymore.
The structure changed.
This is one of the biggest dangers of using an RSI range strategy.
Watch for Breakout Conditions
Be cautious when you see:
- Strong candle closing outside resistance.
- Increasing volume, where reliable volume data is available.
- Follow-through after the breakout.
- Price holding above the previous resistance.
- RSI staying strongly above 50.
- A clear sequence of higher highs and higher lows.
The opposite applies to downside breaks.
A failed range can become a trend.
And a range strategy that worked beautifully yesterday may be completely inappropriate today.
Common Mistakes When Using RSI in a Sideways Market
1. Buying Every RSI Reading Below 30
This is probably the classic mistake.
RSI below 30 tells you momentum has been weak.
It does not tell you exactly where price will stop falling.
Wait for location and confirmation.
2. Selling Every RSI Reading Above 70
Same problem.
Overbought doesn’t automatically mean “price must fall now.”
Strong trends can keep RSI elevated.
3. Ignoring Support and Resistance
RSI tells you about momentum.
It doesn’t tell you the complete market structure.
If RSI is 28 while price is sitting in the middle of nowhere, the setup is much less interesting than RSI 28 occurring directly at well-tested support.
4. Trading the Middle of the Range
This is where risk/reward can become awkward.
Suppose your range is:
100 → 110
Buying at 105 means you’re potentially buying halfway between support and resistance.
There may not be enough room for a clean range trade.
Patience matters.
5. Using Too Many Indicators
Adding indicators doesn’t automatically add confirmation.
Sometimes it just adds confusion.
Start with:
Price structure + RSI + price action
Then test whether another tool genuinely improves your results.
6. Moving the Stop-Loss
This is a psychological trap.
Price gets close to your stop.
You move it farther away.
Then again.
And again.
Eventually, a small planned loss becomes a much larger one.
Define the invalidation level before entering.
7. Assuming Every Range Will Continue
Markets change.
A sideways market can transition into a breakout without giving you a polite warning.
That’s why your strategy should have a clear condition for saying:
“The range setup is no longer valid.”
A Simple RSI Sideways Market Checklist
Before entering a trade, ask yourself:
Market Structure
- Is the market genuinely sideways?
- Are support and resistance clearly visible?
- Has price respected these zones multiple times?
RSI
- Is RSI near an extreme?
- Has RSI started turning?
- Has RSI crossed back through 30 or 70?
Price Action
- Is there a rejection candle?
- Has a minor swing been broken?
- Is the candle structure supporting the trade idea?
Risk
- Where is the setup invalidated?
- Is the potential reward reasonable compared with the risk?
- Am I risking an amount I can accept losing?
Trade Quality
- Am I trading near the range boundary?
- Or am I entering simply because I don’t want to miss the move?
That last question is surprisingly useful.
How to Backtest This RSI Strategy
Don’t judge a strategy after five trades.
That’s too small a sample.
Instead, collect a meaningful historical sample.
For example:
- Choose one market.
- Choose one timeframe.
- Use RSI 14 initially.
- Mark sideways ranges.
- Record every qualifying setup.
- Record entry, stop and target.
- Track the result.
- Record maximum adverse excursion if possible.
- Calculate your win rate and average reward/risk.
- Review losing trades separately.
Create a simple spreadsheet with columns such as:
| Trade | Market | RSI | Location | Setup | Stop | Target | Result |
|---|---|---|---|---|---|---|---|
| 1 | EUR/USD | 27 | Support | Long | 20 pips | 40 pips | Win |
| 2 | EUR/USD | 29 | Mid-range | Long | 20 pips | 40 pips | Loss |
| 3 | EUR/USD | 73 | Resistance | Short | 18 pips | 36 pips | Win |
After 50–100 properly recorded examples, you’ll have much more useful information than you would from watching three successful YouTube trades.
And here’s the important part:
Don’t change the rules halfway through the test.
Otherwise, you’re not really testing a strategy.
You’re testing your ability to rewrite history.
Useful Internal Links for BlogWithVarun
You can strengthen this article with contextual internal links to your related trading content.
Recommended placements
After discussing RSI confirmation:
If you’re interested in combining momentum with another confirmation method, see our guide on [RSI with Volume Confirmation Strategy].
After discussing MACD vs RSI:
You can also compare the two indicators in our detailed guide on [MACD vs RSI for Reversal Trading].
After discussing range boundaries:
Before applying RSI to a range, make sure you understand how to identify [Support and Resistance] correctly.
After discussing price action:
For a broader understanding of candle-based decision-making, read our guide to [Price Action Trading].
Use the actual URLs of those published BlogWithVarun articles when inserting the links in WordPress. This keeps the internal-link structure natural instead of forcing unrelated pages into the article.
Useful External Links
For readers who want to understand the technical background of RSI, these are useful authoritative resources:
- TradingView — RSI explanation and settings: TradingView RSI Guide
- Fidelity — Relative Strength Index: Fidelity RSI Guide
- Fidelity — Technical Analysis Overview: Fidelity Technical Analysis Guide
These external references support the basic RSI mechanics, traditional 30/70 levels, momentum interpretation, and the importance of considering broader technical context.
Final Thoughts
The biggest lesson is simple:
RSI isn’t the strategy.
It is one piece of information.
When the market is sideways, RSI can become especially useful because price repeatedly moves between support and resistance. But the strongest setups usually come from combining market structure + RSI + price action + risk management, rather than blindly buying at 30 or selling at 70.
In my experience, the biggest improvement often comes from learning when not to trade.
If the market is trending strongly, step back.
If price is sitting in the middle of a range, wait.
If RSI gives a signal at a meaningful support or resistance zone, then pay attention.
That’s a much more disciplined way to use the indicator.
What has worked better for you in a sideways market—RSI 30/70 reversals, RSI divergence, or RSI combined with support and resistance? Share your approach in the comments.
Frequently Asked Questions
How does RSI in sideways market trading work?
1. Is RSI good for a sideways market?
Yes. RSI can be useful in a sideways market because price often oscillates between support and resistance while momentum moves between stronger and weaker conditions. However, RSI should not be used as a standalone buy or sell signal.
2. What RSI levels should I use in a sideways market?
The traditional levels are 30 for oversold and 70 for overbought. Some traders use different thresholds depending on the market and timeframe, so the best settings should be tested rather than assumed.
3. Should I buy when RSI goes below 30?
Not automatically. In a sideways market, a stronger setup may occur when RSI reaches oversold territory near established support and then begins recovering, especially when price action confirms the rejection.
4. Is RSI better than MACD for a sideways market?
RSI is often more naturally suited to identifying overbought and oversold conditions inside a range, while MACD is commonly used to assess changes in momentum and trend. Neither indicator is universally better; test the combination that fits your market and timeframe.
⚠️ Disclaimer
This article is for educational and informational purposes only and does not constitute financial, investment, or trading advice. Trading and investing involve risk, and losses can occur. Always conduct your own research, define your risk before entering a trade, and consider consulting a qualified financial professional where appropriate.