4 Best Ways to Combine Candlestick Patterns with RSI
You are staring at a bullish engulfing candle on the chart, but you hesitate. Is it a genuine reversal or a bull trap designed to hunt your stop-loss? To filter out market noise and time high-probability entries, you need to combine candlestick patterns with RSI (Relative Strength Index). Candlesticks show you exactly what buyers and sellers are doing at this exact moment, while RSI confirms if there is enough underlying momentum to sustain the move.
Trading isolated candlestick patterns in today’s algorithmic markets often leads to death by a thousand cuts. A hammer candle in a strong downtrend is usually just a brief pause before another crash. However, when you combine candlestick patterns with RSI, you create a dual-verification system that keeps you out of low-probability trades and protects your capital.
Why You Must Combine Candlestick Patterns with RSI
Indicators like RSI are mathematically derived from past price data. A common mistake beginners make is treating an RSI reading of 30 strictly as a “buy” signal and 70 as a “sell” signal. This is a fundamentally flawed RSI candlestick strategy that will quickly drain your trading account in a trending market.
RSI measures the speed and change of price movements. Candlesticks, on the other hand, measure immediate human psychology and institutional order flow. When you properly combine candlestick patterns with RSI, you aren’t just guessing that a stock is “too cheap” because a line on a graph hit the bottom. You are waiting for the exact moment when selling momentum has mathematically exhausted itself (the RSI) and major buyers have physically stepped in to reverse the price (the Candlestick).
Think of RSI as the fuel gauge in a car and the candlestick as the steering wheel. RSI tells you when the sellers are running out of gas. The candlestick tells you when the buyers have grabbed the wheel and turned the car around. You need both pieces of information to execute a profitable trade.
Tweaking RSI Settings for Indian Markets
Before diving into the setups, we need to address the default indicator settings. Almost every charting platform (like TradingView or Zerodha Kite) defaults the RSI to a 14-period lookback with 70/30 overbought/oversold bands.
While 14 is the industry standard created by J. Welles Wilder, the Indian market—especially high-beta indices—can be extremely volatile. If you want to successfully combine candlestick patterns with RSI for active swing trading or intraday trading, you might find standard settings too sluggish.
Many professional Indian traders adjust their RSI settings based on their trading style:
- For Bank Nifty RSI Trading (Intraday): Using a 9-period RSI makes the indicator far more sensitive to sudden intraday moves, helping you catch rapid options premium spikes.
- For Trend-Following Swing Trades: Shifting the bands from 70/30 to 60/40 is highly effective. In a strong bull market like the Nifty 50 often experiences, the RSI will rarely drop to 30. A pullback to 40 is often all you get before the next leg up.
Always align your indicator settings with the specific asset’s historical volatility. A mid-cap IT stock will respect different RSI boundaries than a slow-moving PSU like Coal India.
4 Proven Setups to Combine Candlestick Patterns with RSI
📌 Must Read: If you need a refresher on candle anatomy, check out Top 5 Candlestick Patterns Every Indian Swing Trader Must Know to spot valid reversal wicks faster.
Here are four specific, actionable ways to combine candlestick patterns with RSI in the live market to catch major reversals and continuations.
1. The Oversold Reversal (RSI < 30 + Bullish Engulfing)
When a stock crashes aggressively, the RSI will dip below 30 into oversold territory. Do not buy yet. Catching a falling knife is the fastest way to blow up an account. Instead, wait for a bullish engulfing RSI setup.
This happens when a large green candle completely eclipses the body of the previous red candle while the RSI is below 30. The low RSI tells you the rubber band is stretched to its absolute limit. The engulfing candle is the snapback. This setup is highly effective on daily charts for swing trading large-cap Indian stocks that have corrected 15-20% from their all-time highs.
2. The Overbought Exhaustion (RSI > 70 + Shooting Star)
If Nifty has rallied for six straight days, the RSI might push well above 75. Retail traders feel intense FOMO and continue buying the breakout highs. You should be sitting on the sidelines watching for a Shooting Star (a candlestick with a small real body at the bottom and a very long upper shadow).
The long upper shadow indicates that buyers tried to push the price higher, but aggressive institutional sellers immediately rejected it, driving the price back down. The high RSI confirms the bullish momentum was already running on fumes. This combination is a classic signal to book profits on long positions or initiate a calculated short trade.
3. The Divergence Trap (RSI Divergence + Hammer)
This is the most powerful setup for identifying major market bottoms and avoiding false breakouts. If you want to master reversal trading, you must combine candlestick patterns with RSI divergence.
Bullish divergence occurs when the price of a stock makes a lower low, but the RSI makes a higher low. The downward price action suggests weakness, blinding retail traders to the fact that the selling pressure is actually fading beneath the surface.
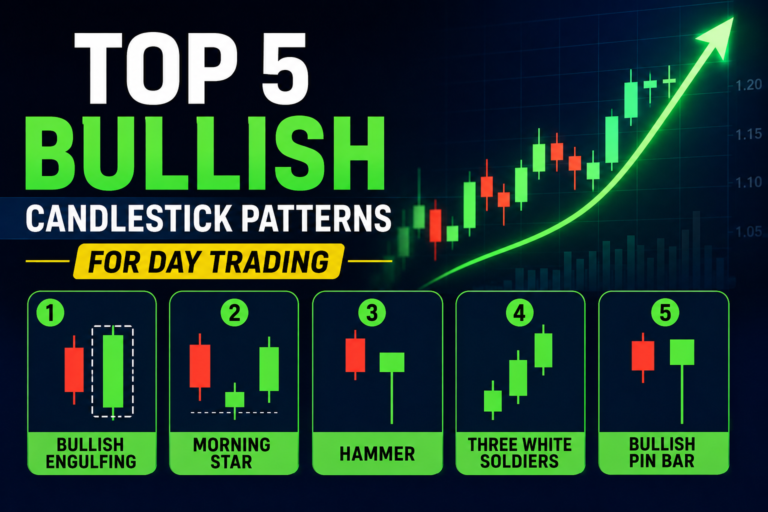
When you spot this divergence, look for an oversold RSI candlestick like a Hammer or a Morning Star at a key daily support level. The divergence tells you the bears are exhausted; the hammer provides your specific, low-risk entry trigger.
4. The Hidden Trend Continuation (RSI 40-50 + Piercing Line)
Not every trade is a major trend reversal. In a strong bull market, you want to buy the dips. When a stock is trending upward, its RSI will naturally oscillate. During a healthy pullback, the RSI might drop from 75 down to the 40-50 zone.
This is not technically “oversold,” but in a strong uptrend, 40 acts as a momentum floor. If a stock pulls back to the 20-day moving average, the RSI hits 45, and you see a Piercing Line or a strong bullish Pin Bar, you have a high-probability continuation trade. The primary trend is up, the pullback has exhausted the weak hands, and the candlestick signals the resumption of the broader rally.
Real Market Example: Bank Nifty RSI Trading Intraday
💡 Related Reading: Before trading live index charts, read our complete guide on The Ultimate Guide to Support and Resistance Trading in Nifty 50 to identify where price action reversals are most likely to hold.
Let’s look at a practical, numbers-based example of how to execute this concept on a Bank Nifty 15-minute chart.
- The Context: Bank Nifty has been sliding since the 9:15 AM opening bell, dropping heavily from 48,200 down to 47,600 by 1:30 PM.
- The Momentum: The 14-period RSI on the 15-minute chart hits 22. It is deeply oversold.
- The Trap: A beginner sees the RSI at 22, assumes a bounce is guaranteed, and buys an at-the-money Call option immediately without waiting for candlestick confirmation. Over the next 30 minutes, Bank Nifty chops sideways and drops further to 47,550. The beginner’s option premium decays rapidly due to theta, and they exit at a loss out of panic.
- The Professional Entry: You wait. You know you must combine candlestick patterns with RSI. At 2:15 PM, Bank Nifty touches a known daily support level at 47,500. It forms a massive Bullish Pin Bar (a Hammer) with a long lower wick, closing decisively at 47,620.
- The Execution: You enter long slightly above the high of the hammer (47,625). Your stop-loss goes strictly below the hammer’s bottom wick (47,490). Because you waited for the candlestick to visually confirm the RSI exhaustion, the trade has a clear invalidation point and a massive risk-to-reward ratio.
The Two Biggest Traps Beginners Fall Into
Trap 1: Ignoring Multiple Timeframe Context
A bullish engulfing candle with an oversold RSI on a 5-minute chart is completely useless if the Daily chart is forming a massive bearish Marubozu. Institutional money flows on the higher timeframes.
When you combine candlestick patterns with RSI, always check the higher timeframe before executing on a lower one. If the Daily trend is strongly down, do not try to catch 15-minute RSI reversals. You will just get run over by the primary trend. Only take 15-minute oversold setups if the Daily chart is sitting at major support.
Trap 2: The 9:15 AM Gap Trap
Indian markets are heavily influenced by global cues like the US markets and SGX Nifty (GIFT Nifty). Because of this, Nifty and Bank Nifty often open with large gaps.
A massive 300-point gap down in Bank Nifty will instantly drag the RSI below 20 at the opening bell. Do not blindly buy the first 5-minute hammer you see. Gaps heavily distort mathematical indicators. Let the market settle for the first 45 minutes to an hour. Wait for genuine price action to form before trusting the RSI readings after a large overnight gap.
Your Pre-Trade Execution Checklist
Before entering any trade based on momentum and price action, run it through this strict filter to ensure you aren’t fighting the primary trend blindly.
| Trade Condition | What to Look For | Action Required |
| 1. Momentum (RSI) | RSI is < 30 (for longs) or > 70 (for shorts). | Wait. Do not execute. Put the stock on your active watchlist. |
| 2. Context/Location | Price is approaching a prior support/resistance zone, a major moving average, or a key Fibonacci level. | Monitor. Watch the 15-min or 1-hour candles closely as price hits this critical zone. |
| 3. Price Action | A clear reversal candle forms (Engulfing, Pin Bar, Morning/Evening Star) exactly at the zone. | Prepare. Identify the exact high and low of the signal candlestick. |
| 4. Execution | The next candle breaks the high (for longs) or low (for shorts) of your signal candle. | Enter Trade. Place a hard stop-loss just beyond the signal candle’s extreme wick. |