Order Block Trading vs Traditional Support/Resistance: Key Differences Explained
Direct Answer: Order Blocks vs Traditional Support and Resistance
Order Block Trading is an SMC approach that uses price structure, liquidity, and displacement to identify potential institutional reaction zones, while traditional support and resistance focuses mainly on historical price levels.
Traditional traders often ask, “Where did price previously reverse?” SMC traders ask, “What happened before the aggressive move, and where could significant orders have been positioned?”
Support and resistance remain useful. However, order block trading adds concepts such as liquidity, displacement, market structure, and institutional order flow to the analysis. Importantly, an order block should not be treated as proof that banks placed orders at one exact candle. In retail SMC, it is better understood as a price-action framework for identifying areas where significant buying or selling may have influenced the move.
For a conventional explanation of support and resistance, see Investopedia’s Support and Resistance guide.
1. The Problem with Retail Support and Resistance
Order Block Trading looks beyond simple horizontal levels by studying liquidity and the price action surrounding important market areas.
Traditional support and resistance is one of the first concepts most traders learn.
Support is an area where previous buying pressure helped stop a decline. Resistance is an area where previous selling pressure helped stop an advance.
The concept is valid. The problem is how many retail traders use it.
A common approach looks like this:
- Find an obvious swing low.
- Draw a horizontal support line.
- Wait for price to return.
- Buy when price touches the level.
- Put the stop loss immediately below support.
The opposite is used at resistance.
The problem is that obvious levels are visible to thousands of traders. When many traders place buy orders, stop losses, and breakout orders around the same area, the region can contain a concentration of executable orders.
This is where liquidity becomes important.
Liquidity Sweeps and Stop Hunts
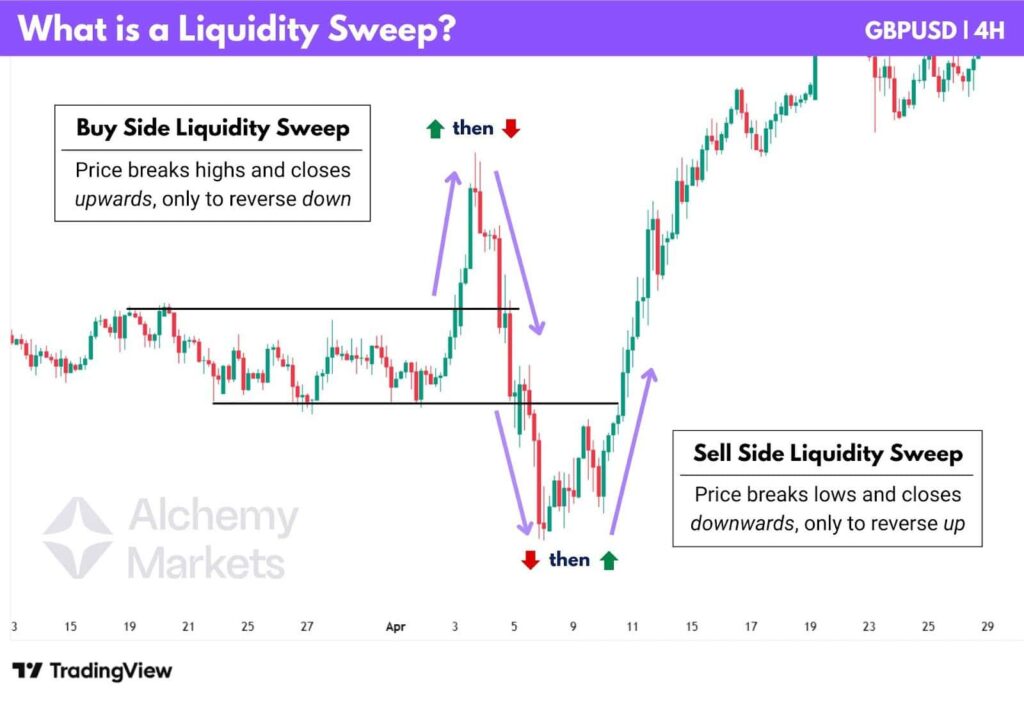
Suppose EUR/USD is repeatedly holding around 1.1000. Retail traders may identify 1.1000 as support and place:
- Buy orders around support
- Stop losses below support
- Breakout sell orders below support
Price can temporarily trade below 1.1000, triggering sell-side stops, before quickly recovering above the level.
An SMC trader may describe this as a liquidity sweep.
However, calling every stop-loss hit a deliberate “stop hunt” is an oversimplification. Markets can trigger clustered stops simply because those orders become available when price reaches the area.
CME Group’s educational material explains that stop orders become market orders when their trigger price is reached, which helps explain why clusters of stops can contribute to fast price movement.
The key lesson: Do not assume that a support level must hold simply because it has worked before.
Instead, watch what price does after liquidity is taken.
For more beginner-friendly trading education, you can also explore the trading resources on Blog With Varun.
2. How Order Block Trading Works
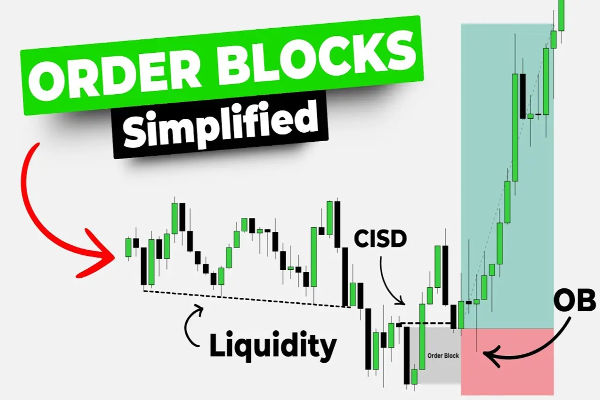
In Order Block Trading, traders use the candle or price zone preceding strong displacement as a potential area of interest.
An order block is an SMC concept used to identify a price area associated with the price action immediately before a strong directional move.
The simplest framework is:
Order Block → Liquidity Event/Accumulation → Displacement → Market Structure Shift
The exact definition varies between SMC traders, so there is no single universally accepted institutional definition of an order block.
Bullish Order Block
A bullish setup in Order Block Trading generally focuses on the final bearish candle before strong bullish displacement.
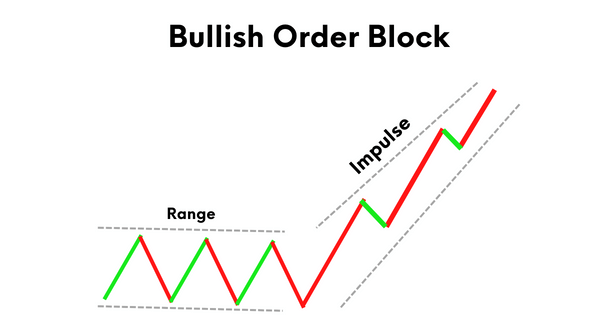
A bullish order block is commonly identified as the final bearish candle or small bearish consolidation before a strong bullish displacement.
For example:
- Price is moving lower.
- Price forms a bearish candle.
- Buyers take control.
- Price aggressively moves higher.
- A previous swing high is broken.
- Price later retraces into the original bearish candle or zone.
- Traders watch the area for a potential bullish reaction.
The bearish candle becomes the potential bullish order block.
Bearish Order Block
In Order Block Trading, a bearish order block commonly forms around the final bullish candle before aggressive bearish displacement.
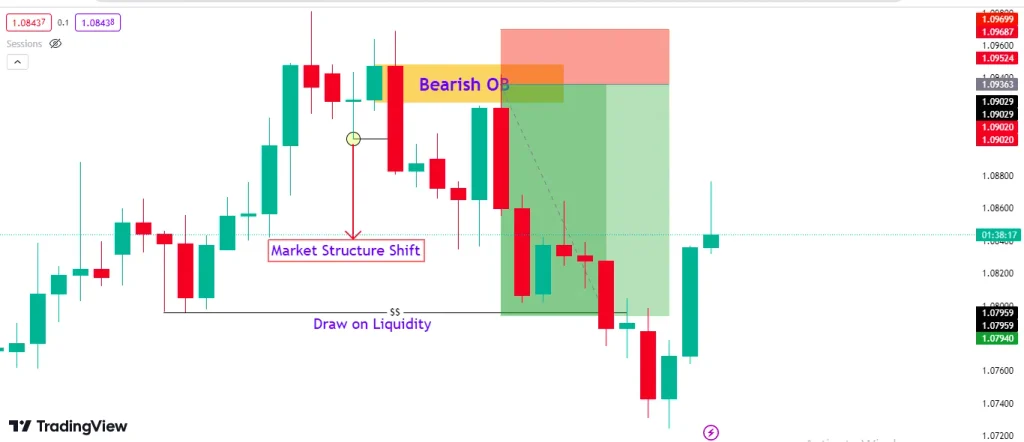
A bearish order block is commonly identified as the final bullish candle or small bullish consolidation before strong bearish displacement.
The sequence may look like:
- Price is moving higher.
- A bullish candle forms.
- Sellers aggressively take control.
- Price moves lower with strong displacement.
- A previous swing low is broken.
- Price retraces into the original bullish candle or zone.
- Traders watch for bearish confirmation.
That previous bullish candle becomes the potential bearish order block.
Important Institutional Trading Reality

Be careful with one popular SMC statement: “Banks put all their orders inside this candle.”
You cannot determine that simply from a retail candlestick chart.
Institutional execution is more complex and can involve multiple venues, order types, algorithms, hedging activity, and execution over time. Therefore, treat an order block as a price-action model, not a guaranteed visual map of institutional orders.
That distinction makes your SMC analysis more realistic.
3. Step-by-Step Guide to Identifying High-Probability Order Blocks
The first rule of Order Block Trading is to establish higher-timeframe market structure before searching for entries.
Not every candle before a large move deserves to be called an order block.
A stronger approach is to combine the order block with market structure and liquidity.
Step 1: Identify the Higher-Timeframe Trend
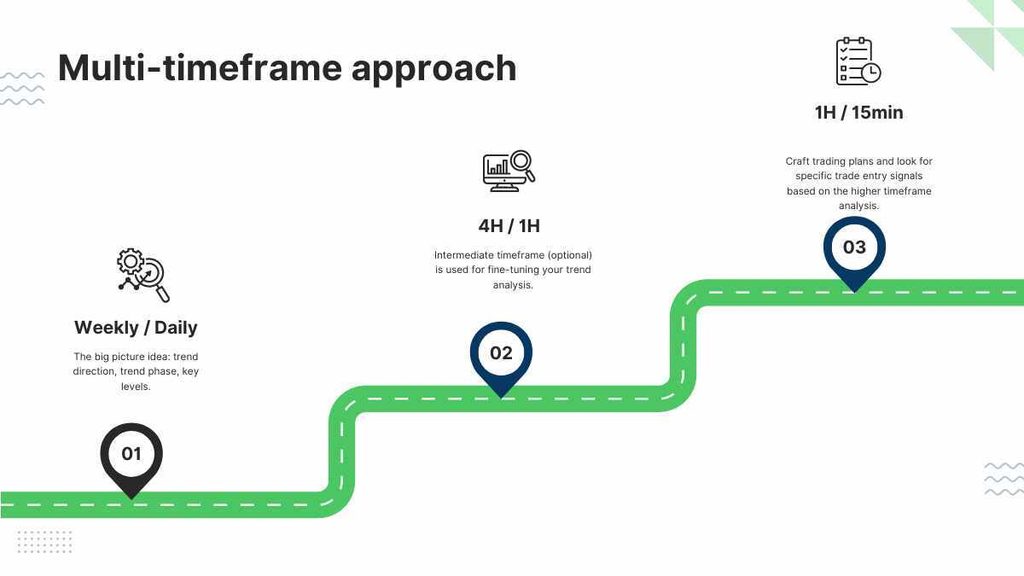
Start with a higher timeframe such as:
- Daily
- 4-hour
- 1-hour
Determine whether price is generally bullish, bearish, or ranging.
For example:
Higher-timeframe bullish structure → prioritize bullish order blocks.
Higher-timeframe bearish structure → prioritize bearish order blocks.
This prevents you from treating every candle as a potential reversal zone.
Step 2: Mark Important Liquidity
Liquidity is an important part of Order Block Trading because an order block becomes more meaningful when it appears around a significant liquidity event.
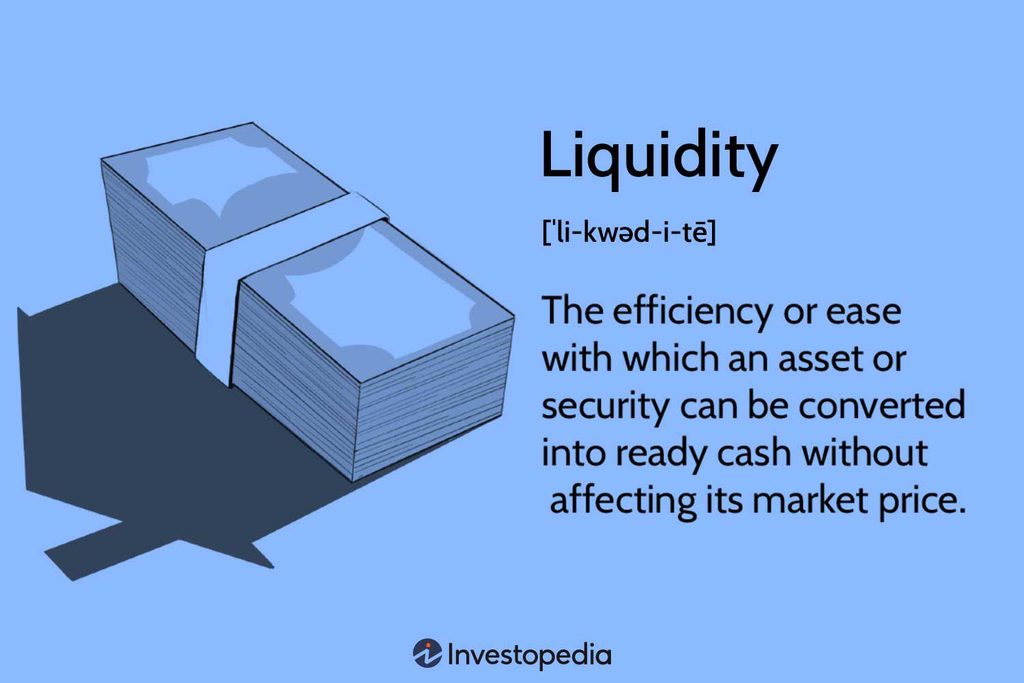
Look for obvious areas where traders may have placed stops or breakout orders.
Examples include:
- Equal highs
- Equal lows
- Previous day high
- Previous day low
- Previous swing highs
- Previous swing lows
- Range highs and lows
Liquidity should provide context for the order block.
A bullish setup becomes more interesting when price first takes sell-side liquidity and then strongly moves upward.
A bearish setup becomes more interesting when price takes buy-side liquidity and then strongly moves downward.
Step 3: Find Strong Displacement
Strong displacement gives Order Block Trading setups additional confirmation because it shows that price moved decisively away from the zone.
Displacement is one of the most important filters.
Look for:
- Large directional candles
- Consecutive candles moving aggressively
- Strong momentum
- Limited overlap between candles
- A clear break of market structure
The stronger the displacement, the more meaningful the preceding price area may become.
Do not select an order block simply because the candle looks attractive.
The move that follows it matters more.
Step 4: Confirm a Market Structure Shift
A market-structure shift can improve an Order Block Trading setup by confirming that momentum may have changed.
After identifying potential displacement, examine whether price actually changed structure.
For a bullish setup, look for price breaking an important previous high.
For a bearish setup, look for price breaking an important previous low.
This helps distinguish a genuine directional shift from a temporary reaction.
Step 5: Mark the Order Block as a Zone
Do not automatically treat one exact price as magical.
Mark the relevant candle or small price range.
For a bullish order block, traders commonly monitor the final bearish candle before bullish displacement.
For a bearish order block, traders commonly monitor the final bullish candle before bearish displacement.
Then wait for price to return to the zone.
Step 6: Wait for a Reaction or Lower-Timeframe Confirmation
This is where many traders improve their execution.
Instead of blindly entering when price touches the order block, wait for confirmation such as:
- Liquidity sweep
- Rejection
- Break of structure
- Change of character
- Strong displacement
- Lower-timeframe confirmation
For example:
4H bullish order block → price returns → 5M sell-side liquidity sweep → bullish structure shift → entry.
This approach can provide a more structured setup than simply buying the first touch.
Step 7: Place the Stop Loss Logically
Proper risk management is essential for Order Block Trading because even high-quality setups can fail.
Your stop loss should invalidate the trade idea.
For a bullish order block, the invalidation point may be below the relevant zone or below the liquidity sweep, depending on the strategy.
For a bearish order block, it may be above the zone or above the sweep.
Do not choose the stop merely because it gives a smaller monetary risk.
Your risk management should come first.
If you want to improve your overall trade planning, connect your SMC setups with a defined risk-reward ratio rather than judging every trade only by whether the order block works.
Step 8: Target Liquidity, Not Random Numbers
An SMC trader often looks toward opposing liquidity for potential targets.
For a bullish trade, possible targets include:
- Previous swing high
- Equal highs
- Buy-side liquidity
- Previous day high
For a bearish trade:
- Previous swing low
- Equal lows
- Sell-side liquidity
- Previous day low
This creates a logical relationship between entry, stop loss, and target.
4. Traditional Support/Resistance vs Order Blocks
The biggest difference between Order Block Trading and traditional support and resistance is the amount of market context used to evaluate the price zone.
| Feature | Traditional Support/Resistance | Order Blocks |
|---|---|---|
| Definition | Historical price area where buying or selling previously reacted | Price-action zone preceding significant displacement |
| Main Focus | Previous highs, lows and reaction levels | Liquidity, displacement and market structure |
| Chart Appearance | Usually horizontal line or zone | Usually candle-based zone |
| Entry Style | Buy at support or sell at resistance | Wait for return to order block and confirmation |
| Liquidity Focus | Usually limited | Central part of SMC analysis |
| Market Structure | Optional | Usually important |
| Stop Loss | Commonly beyond support/resistance | Usually beyond order-block invalidation |
| Confirmation | Often price rejection | Liquidity sweep, displacement or structure shift |
| Potential Weakness | Obvious levels can fail or be swept | Subjective identification can lead to over-marking |
| Best Use | Simple price mapping | Contextual price-action analysis |
Traditional support and resistance is not “wrong.”
In fact, SMC traders often use the same swing highs and lows that traditional technical analysts use.
The difference is how those levels are interpreted.
Zerodha’s educational material similarly describes support and resistance as price points where buying or selling interest may become concentrated.
5. Which Approach Is Better?
There is no universal winner.
Support and resistance is simpler. Order blocks are more contextual.
A beginner may draw support and resistance and immediately look for a reaction.
An SMC trader may instead ask:
Where is liquidity?
Was liquidity swept?
Did price create displacement?
Did market structure change?
Which candle preceded that displacement?
Where is the most logical invalidation point?
This creates a more detailed decision-making process.
But more complexity does not automatically mean higher accuracy.
A badly identified order block is still a bad trade.
A well-defined support level combined with trend, liquidity, volume, and risk management can be highly useful.
The goal is not to replace every traditional concept with SMC terminology.
The goal is to read price with better context.
6. A Practical SMC Example
This example shows how Order Block Trading can combine liquidity, displacement, structure, and confirmation into one trading framework.
Imagine XAU/USD is trading in a short-term bullish environment.
Price approaches a previous low where many traders expect support.
Instead of immediately buying, you observe:
- Price breaks below the previous low.
- Sell-side liquidity is taken.
- Price quickly rejects the lower level.
- Strong bullish candles appear.
- A previous short-term high is broken.
- The final bearish candle before the bullish displacement is marked as a potential bullish order block.
- Price retraces into the zone.
- A lower-timeframe bullish structure shift appears.
- Entry is considered.
- Stop loss is placed beyond the trade’s invalidation point.
- The target is positioned around opposing liquidity.
Notice the difference.
A traditional trader may have entered at the original support.
The SMC trader waited to see what happened when support failed.
That is the major conceptual upgrade.
7. Common Order Block Trading Mistakes
1. Marking Every Candle as an Order Block
If every candle is an order block, the concept becomes useless.
Only mark areas associated with meaningful displacement and structure.
2. Ignoring Higher-Timeframe Structure
A beautiful 5-minute bullish order block can fail inside a strong daily bearish trend.
Always establish context first.
3. Entering Every First Touch
Experienced traders often avoid entering an Order Block Trading setup blindly on the first touch.
An order block is not a guaranteed reversal point.
Wait for evidence.
4. Calling Every Wick a Liquidity Sweep
A wick alone does not prove institutional manipulation.
Look for what happens afterward.
5. Using Extremely Tight Stops
A tiny stop can produce attractive risk-reward numbers but may sit inside normal market noise.
Your stop should be based on trade invalidation, not wishful thinking.
6. Overcomplicating the Chart
SMC can become confusing when traders add:
- Too many order blocks
- Multiple liquidity zones
- Every imbalance
- Every minor structure break
- Too many timeframes
A clean chart often produces better decisions.
8. How to Combine Support/Resistance With Order Blocks
You do not need to choose one methodology.
A powerful hybrid approach can be:
Traditional S/R → Liquidity → Market Structure → Order Block → Confirmation → Risk Management
For example, a previous resistance level may also contain a bearish order block.
That gives you two different pieces of information:
- Traditional analysis identifies the important price area.
- SMC analysis explains the liquidity and structure around that area.
This combination can be more practical than treating SMC and traditional technical analysis as competing systems.
Final Takeaway
Order Block Trading vs Traditional Support/Resistance is not really a battle between two completely different systems.
Traditional support and resistance tells you where price has previously reacted.
Order block analysis attempts to explain what price did before a significant displacement and how liquidity and market structure may provide context around that area.
The strongest approach is not to blindly trust either concept.
Instead:
- Start with higher-timeframe structure.
- Mark important support and resistance.
- Identify liquidity.
- Wait for a sweep when appropriate.
- Look for displacement.
- Confirm market-structure change.
- Identify the relevant order block.
- Wait for a controlled retracement.
- Define invalidation.
- Calculate risk before entering.
An order block is a setup area, not a guaranteed entry.
Support and resistance is a map, not a promise.
Your edge comes from how consistently you combine price structure, liquidity, confirmation, and risk management.
For additional trading concepts and practical market guides, visit Blog With Varun.
Financial Disclaimer
Disclaimer: This article is for educational and informational purposes only and does not constitute financial, investment, trading, or investment-advisory advice. Trading forex, CFDs, commodities, stocks, futures, and other financial instruments involves substantial risk of loss. Smart Money Concepts, order blocks, liquidity sweeps, support and resistance, and other technical-analysis methods do not guarantee profitable results. Always conduct your own research, use appropriate risk management, and consider your financial circumstances and risk tolerance before trading. Past performance does not guarantee future results.