
Candlestick Patterns Explained: 15+ Patterns Every Trader Should Know
“The market speaks through price, and candlesticks are its language.”
Whether you’re trading Stocks, Forex, Gold (XAU/USD), Cryptocurrency, Commodities, or Indices, understanding candlestick patterns is one of the most valuable skills you can develop. Every candle tells a story—a story of fear, greed, confidence, uncertainty, and the ongoing battle between buyers and sellers.
If you’ve ever looked at a trading chart and wondered why professional traders seem to predict market movements before they happen, the answer often lies in their ability to read candlestick patterns. They don’t rely on luck—they understand the psychology hidden inside every candle.
This complete guide will take you from the basics to advanced concepts, helping you learn how candlestick patterns work, why they form, and how to trade them successfully. Whether you’re a beginner or an experienced trader, this article will help you build a stronger foundation in price action trading and improve your market decisions.
📈 What Are Candlestick Patterns?
Imagine trying to understand a movie by watching only the last five minutes. You’d probably miss the story, the emotions, and the reasons behind what happened. Trading without understanding candlestick patterns is very similar. Prices move every second, but without learning how to read the candles, you’re only seeing numbers instead of the story behind those movements.
A candlestick is a visual representation of price movement over a selected time period. It displays four important pieces of information:
- Opening Price
- Closing Price
- Highest Price
- Lowest Price
These four values are enough to tell traders who dominated the market during that period—buyers or sellers.
Unlike traditional line charts that only display closing prices, candlestick charts reveal much more information. They show momentum, rejection, indecision, trend strength, and even possible reversals. This is why almost every professional trading platform, including TradingView, MetaTrader, and other charting software, uses candlestick charts as the default view.
Candlestick patterns are formed when one or more candles create recognizable shapes. These patterns often repeat because human emotions such as fear, greed, optimism, and panic remain constant in financial markets. Whether you’re trading Apple shares, Bitcoin, Gold (XAU/USD), or the EUR/USD currency pair, the psychology driving the market is remarkably similar.
💡 Pro Tip: Candlestick patterns become significantly more reliable when combined with support and resistance levels, trend analysis, and volume confirmation rather than being traded in isolation.
You can also practice identifying candlestick patterns on live charts usingi.tradingview.com, one of the most popular charting platforms among traders.
🇯🇵 The History of Japanese Candlesticks
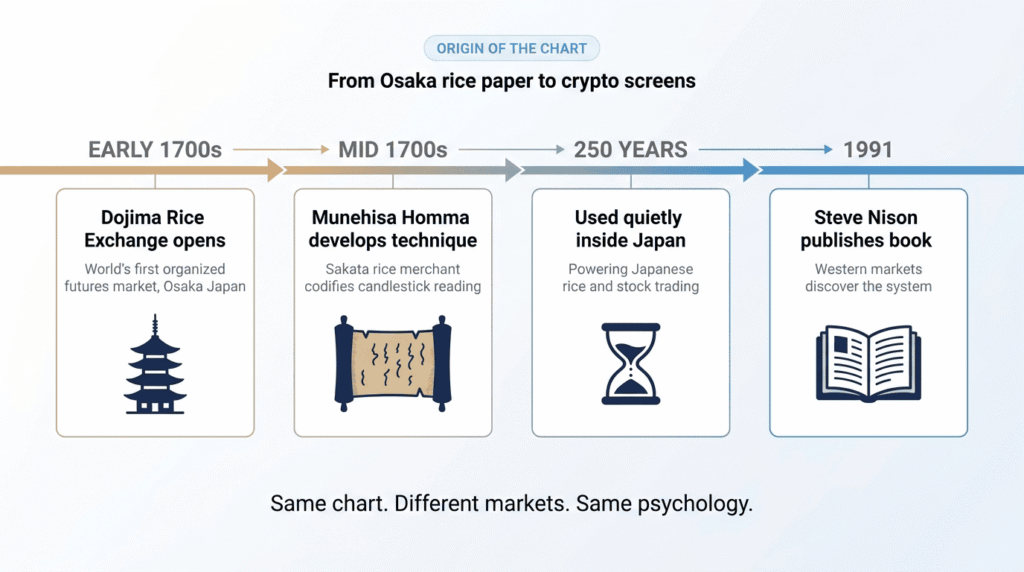
The fascinating story of candlestick charts begins in Japan during the 18th century. Long before modern computers, online trading platforms, and financial apps existed, rice merchants needed a better way to understand price movements. One trader, Munehisa Homma, became famous for studying not only prices but also the emotions influencing those prices.
Homma noticed that markets didn’t move purely because of supply and demand. Human emotions—fear, greed, excitement, and uncertainty—played a major role. By carefully observing price behavior, he discovered recurring formations that reflected these emotions. These observations eventually evolved into what we now know as Japanese candlestick charts.
His methods proved incredibly successful, reportedly making him one of the most respected traders of his time. Centuries later, his concepts remain relevant because markets are still driven by people, and people continue to react emotionally to news, opportunities, and risks.
Candlestick charting gained global recognition when financial analysts introduced it to Western markets in the late 20th century. Today, it is considered one of the most effective tools for technical analysis, helping traders identify trends, reversals, and market sentiment across stocks, forex, commodities, and cryptocurrencies.
📌 Quick Note: Technology has changed dramatically, but market psychology has not. This is why candlestick patterns continue to work across different markets and timeframes.
⭐ Why Every Trader Should Learn Candlestick Patterns
Many beginners believe successful trading depends on finding the “perfect indicator.” They spend hours searching for magical combinations of moving averages, oscillators, or custom indicators. The reality is that professional traders often begin with price action, and candlestick patterns are the foundation of price action analysis.
Candlestick patterns allow you to understand what the market is doing right now, rather than reacting after indicators generate signals. They reveal whether buyers are gaining strength, sellers are losing momentum, or the market is simply waiting for new information.
Some of the biggest advantages of learning candlestick patterns include:
| Benefit | Why It Matters |
|---|---|
| 📈 Early Trend Detection | Identify trends before they become obvious |
| 🎯 Better Entries | Improve trade timing with higher-probability setups |
| 🛡️ Risk Management | Place logical stop-loss levels based on market structure |
| 🧠 Market Psychology | Understand the emotions behind price movements |
| 🌍 Universal Application | Works in Stocks, Forex, Crypto, Commodities, and Indices |
Candlestick analysis is also highly flexible. Whether you’re a scalper using a one-minute chart, a day trader following intraday movements, or a swing trader holding positions for several days, candlestick patterns provide valuable insights. They help traders make informed decisions instead of relying on guesswork.
⚠️ Common Mistake: A single candlestick pattern should never be treated as a guaranteed buy or sell signal. Always consider the broader trend, nearby support and resistance levels, trading volume, and overall market context before entering a trade.

🔍 Anatomy of a Candlestick
Before learning advanced candlestick patterns like the Hammer, Doji, Engulfing, or Morning Star, it’s essential to understand the structure of an individual candle. Every candlestick tells a complete story of the price action during a specific period.
Each candlestick consists of four key components:
- Open: The price at which the trading period began.
- Close: The price at which the trading period ended.
- High: The highest price reached during that period.
- Low: The lowest price reached during that period.
The thick rectangular section is known as the real body. It represents the difference between the opening and closing prices. A long body indicates strong buying or selling pressure, while a small body suggests indecision or balanced market activity.
The thin lines extending above and below the body are called wicks or shadows. These show how far the price moved beyond the opening and closing levels. Long upper wicks may indicate that buyers pushed prices higher but sellers regained control before the candle closed. Long lower wicks suggest that sellers initially dominated, but buyers stepped in and drove prices back up.
Understanding these basic components is the first step toward recognizing more advanced candlestick patterns. Once you can read the story behind a single candle, identifying multi-candle formations becomes much easier.
💡 Pro Tip: Think of every candlestick as a summary of the battle between buyers and sellers. The body shows who won, while the wicks reveal how intense the fight was.
Understanding Market Psychology & The Most Powerful Candlestick Patterns
💡 Golden Rule: A candlestick pattern doesn’t predict the future—it reveals the current balance of power between buyers and sellers.
In Part 1, you learned the basics of candlestick charts, their history, and how individual candles represent market activity. Now it’s time to move deeper into the psychology behind price action and discover the candlestick patterns that professional traders watch every day.
🟢 Bullish vs 🔴 Bearish Candles
Every candlestick tells you who controlled the market during a specific period. Understanding the difference between bullish and bearish candles is the first step toward reading charts with confidence.
🟢 Bullish Candles
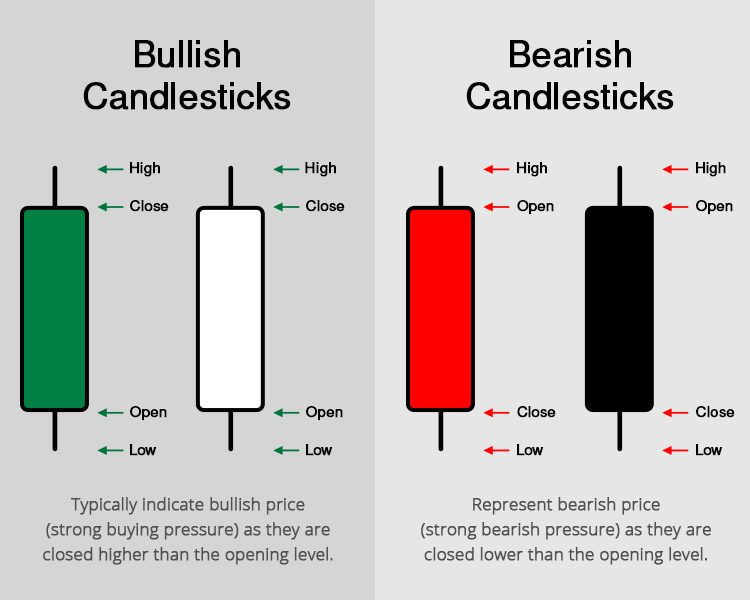
A bullish candle forms when the closing price is higher than the opening price. This means buyers were stronger than sellers during that trading session. On most charting platforms, bullish candles are shown in green, although some traders use white.
A bullish candle reflects confidence in the market. The longer the candle’s body, the stronger the buying pressure. When several large bullish candles appear consecutively, it often signals that buyers are in control and a strong uptrend may be developing.
Bullish candles are particularly significant when they appear near support levels, after a prolonged decline, or alongside increased trading volume. These situations may indicate that buyers are stepping back into the market with conviction.
📌 Characteristics of a Bullish Candle
| Feature | Meaning |
|---|---|
| 🟢 Green Body | Buyers closed the price above the opening level |
| 📈 Long Body | Strong buying momentum |
| 📉 Small Upper Wick | Buyers remained in control until the close |
| 🔥 High Volume | Stronger confirmation of buying interest |
💡 Pro Tip: A bullish candle is far more reliable when it forms after a pullback in an existing uptrend rather than in a sideways market.
🔴 Bearish Candles
A bearish candle forms when the closing price is lower than the opening price, showing that sellers dominated the trading session. Most trading platforms display bearish candles in red or black.
A long bearish candle often signals aggressive selling pressure. If several large bearish candles appear in succession, it usually reflects fear or panic among market participants. These candles frequently appear after disappointing economic news, weak earnings reports, or major market sell-offs.
Bearish candles become especially important near resistance levels, where selling pressure often increases.
📌 Characteristics of a Bearish Candle
| Feature | Meaning |
|---|---|
| 🔴 Red Body | Sellers closed below the opening price |
| 📉 Long Body | Strong selling pressure |
| ⚡ Small Lower Wick | Sellers maintained control until the close |
| 📊 High Volume | Strong bearish confirmation |
⚠️ Common Mistake: Never assume every red candle means you should sell. Context matters. A bearish candle inside a strong uptrend may simply be a healthy pullback rather than the beginning of a reversal.
🧠 The Psychology Behind Candlestick Patterns
One of the biggest reasons candlestick patterns remain effective is that they are rooted in human psychology. Markets move because millions of participants make decisions based on emotions such as fear, greed, hope, confidence, and uncertainty.
Every candlestick captures these emotions in real time. A long bullish candle often reflects optimism and strong buying interest. A long bearish candle may reveal panic selling. Small-bodied candles, like the Doji, suggest indecision where neither buyers nor sellers have a clear advantage.
Understanding this psychological battle helps traders avoid treating patterns as random shapes. Instead, they begin to interpret what each formation reveals about market sentiment.
For example:
- A Hammer often shows that sellers initially controlled the session, but buyers regained strength before the close.
- A Shooting Star suggests buyers pushed prices higher but failed to hold those gains, allowing sellers to take control.
- A Doji indicates balance and hesitation, often appearing before a significant move.
“To spot these candlestick patterns on live stocks, you need a fast and clear charting platform. I use TradingView to analyze chart patterns in real-time.
📌 Quick Note: Candlestick patterns don’t create price movements—they simply reflect the emotions already present in the market.
📚 Types of Candlestick Patterns
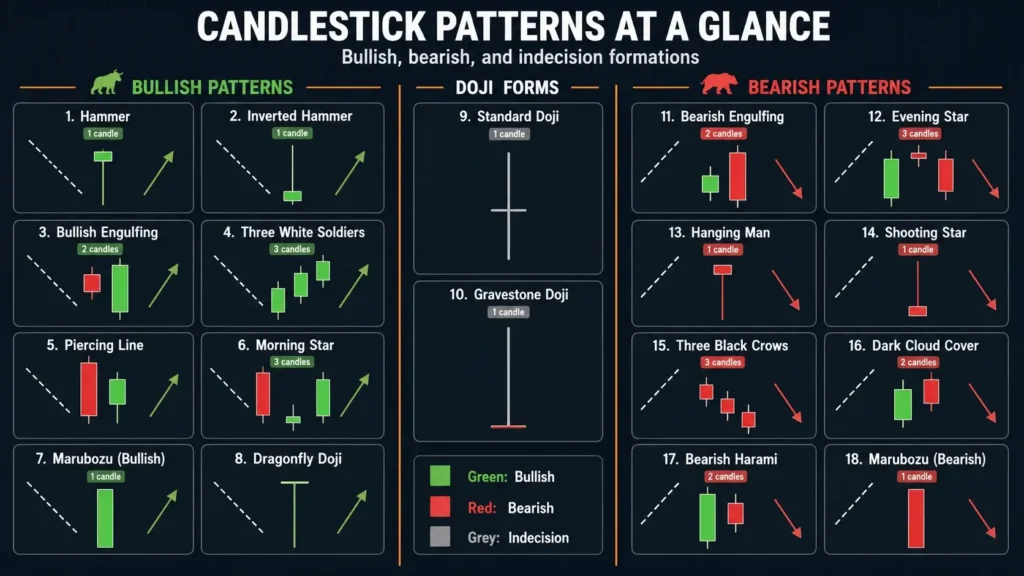
Candlestick patterns are generally divided into three categories based on the number of candles involved.
| Pattern Type | Number of Candles | Examples |
|---|---|---|
| 🟢 Single Candle | One | Hammer, Doji, Hanging Man |
| 🟡 Double Candle | Two | Bullish Engulfing, Bearish Engulfing, Tweezer Top |
| 🔵 Triple Candle | Three | Morning Star, Evening Star, Three White Soldiers |
Each category provides different levels of confirmation. While single-candle patterns can signal a possible reversal, double- and triple-candle formations often offer stronger evidence because they reflect changes over multiple trading sessions.
💡 Professional Insight: The more confirmation a pattern receives from surrounding price action, trend direction, and volume, the higher its reliability.
🔥 Single Candlestick Patterns
Single-candle patterns are among the easiest to identify, making them popular with beginners. Despite their simplicity, they should always be analyzed within the broader market context.
🔨 Hammer Pattern
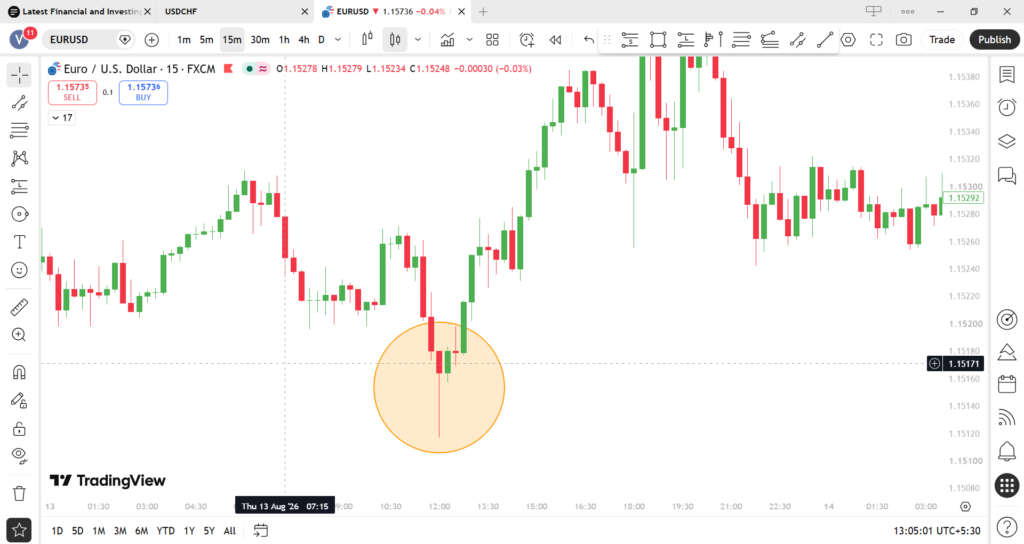
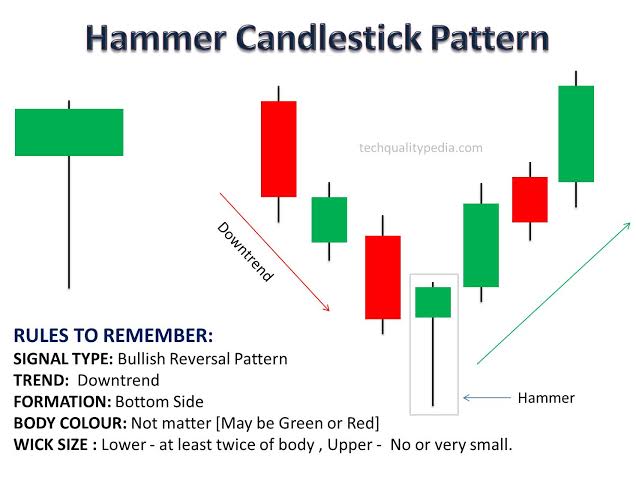
The Hammer is one of the most recognized bullish reversal patterns. It appears after a downtrend and signals that buyers may be regaining control.
📌 How It Forms
- Small body near the top
- Long lower shadow (at least twice the body size)
- Little or no upper shadow
At first, sellers push prices sharply lower. Later in the session, buyers step in aggressively, driving the price back toward the opening level. This shift suggests selling pressure is weakening.
✅ Trading Signal
- Appears after a downtrend
- Indicates potential bullish reversal
- Stronger with high trading volume
- Best near support levels
☂️ Hanging Man
The Hanging Man looks almost identical to the Hammer but appears after an uptrend instead of a downtrend.
Although buyers initially remain in control, the long lower wick reveals that sellers managed to push prices significantly lower during the session. Even if buyers recover before the close, the pattern warns that bullish momentum may be fading.
⚠️ Confirmation from the next candle is essential before entering a bearish trade.
⭐ Inverted Hammer
The Inverted Hammer forms after a downtrend and has a small body with a long upper wick.
This pattern indicates buyers attempted to reverse the trend by pushing prices higher. Although sellers pulled prices back before the close, the buying effort suggests that bullish momentum may be developing.
📈 Reliability increases when followed by a strong bullish candle.
🌠 Shooting Star
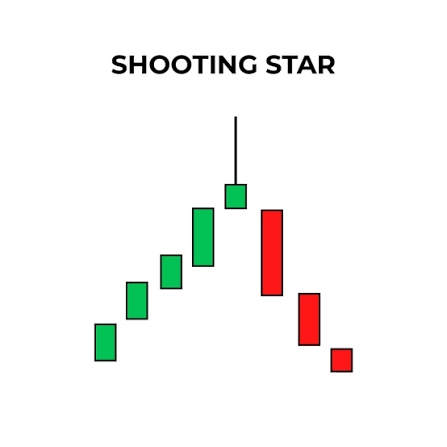
The Shooting Star is the bearish counterpart of the Inverted Hammer.
It appears after an uptrend and has:
- Small body
- Long upper shadow
- Minimal lower shadow
Buyers initially drive prices higher, but sellers completely erase those gains before the session ends. This rejection often signals that the uptrend is losing strength.
⚖️ Doji Pattern
The Doji is one of the most important candlestick patterns because it represents market indecision.
The opening and closing prices are nearly identical, creating a very small body. Neither buyers nor sellers gain a decisive advantage.
A Doji often appears before major market reversals or during periods of consolidation.
Types of Doji
| Doji Type | Meaning |
|---|---|
| Standard Doji | Indecision |
| Dragonfly Doji | Potential Bullish Reversal |
| Gravestone Doji | Potential Bearish Reversal |
| Long-Legged Doji | High Volatility |
💡 Pro Tip: Never trade a Doji alone. Wait for confirmation from the following candle.
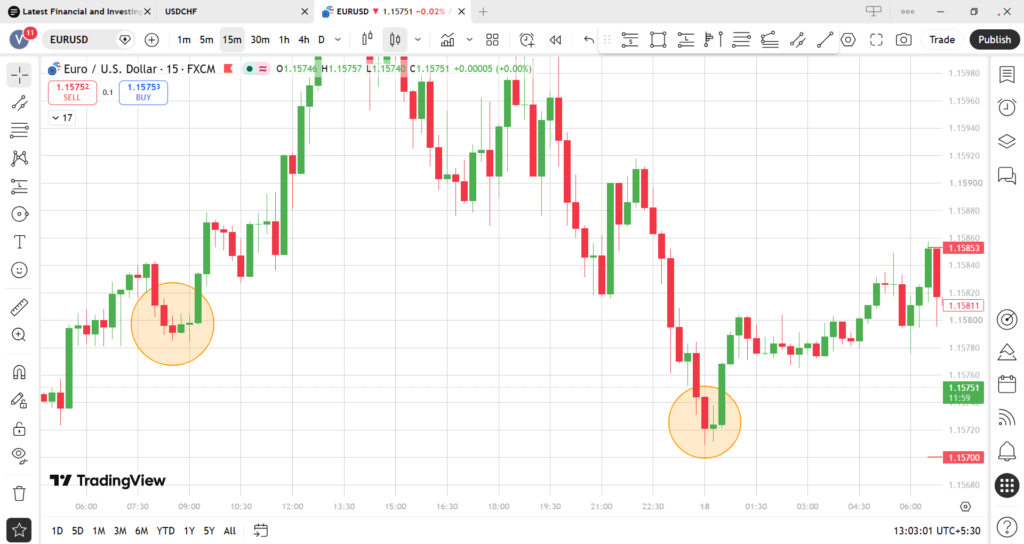
My Example
📈 Spinning Top
A Spinning Top has a small body with relatively long upper and lower shadows.
This pattern indicates that buyers and sellers were both active but neither side managed to establish dominance.
Spinning Tops frequently appear:
- Before trend reversals
- During consolidations
- Near support and resistance zones
Professional traders view this pattern as a signal to wait for additional confirmation rather than entering a trade immediately.
🚫 Common Mistakes When Trading Candlestick Patterns
Even experienced traders can misinterpret candlestick patterns if they ignore the broader market context. Avoiding these common mistakes can significantly improve your trading decisions.
❌ Trading Without Trend Analysis
A bullish reversal pattern inside a strong downtrend may fail if the overall trend remains bearish.
❌ Ignoring Support and Resistance
Patterns become much more meaningful when they form at key price levels rather than in the middle of a range.
❌ Forgetting Volume Confirmation
High trading volume often strengthens the reliability of a candlestick pattern.
❌ Entering Too Early
Many beginners place trades immediately after spotting a pattern. Waiting for the next candle to confirm the signal can help reduce false entries.
❌ Relying on One Pattern Alone
Professional traders combine candlestick analysis with trend direction, moving averages, RSI, MACD, Fibonacci levels, and risk management.
🚀 Powerful Double Candlestick Patterns
Once you’ve mastered single candlestick patterns, the next step is learning double candlestick patterns. These formations consist of two consecutive candles and often provide stronger confirmation because they show how market sentiment changes over two trading sessions instead of one.
Professional traders rely on these patterns to identify potential reversals and continuation opportunities. However, they should always be analyzed alongside the prevailing trend, support and resistance levels, and trading volume for the highest probability setups.
🟢 Bullish Engulfing Pattern
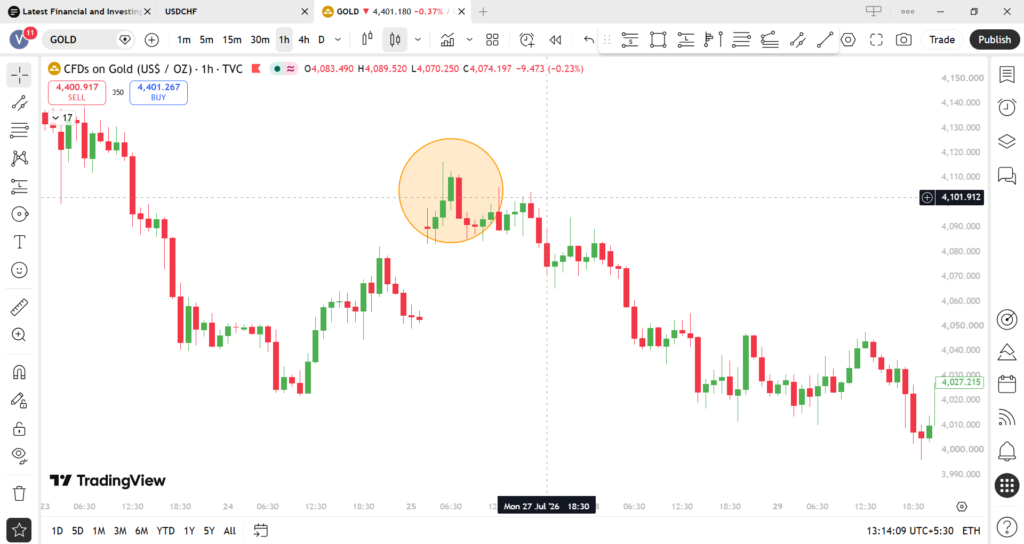
Real Example
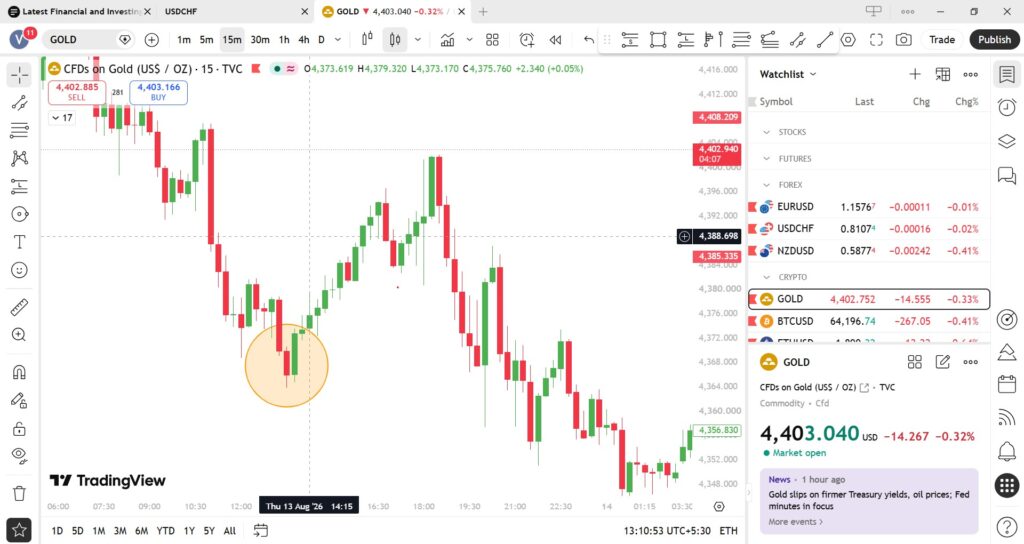
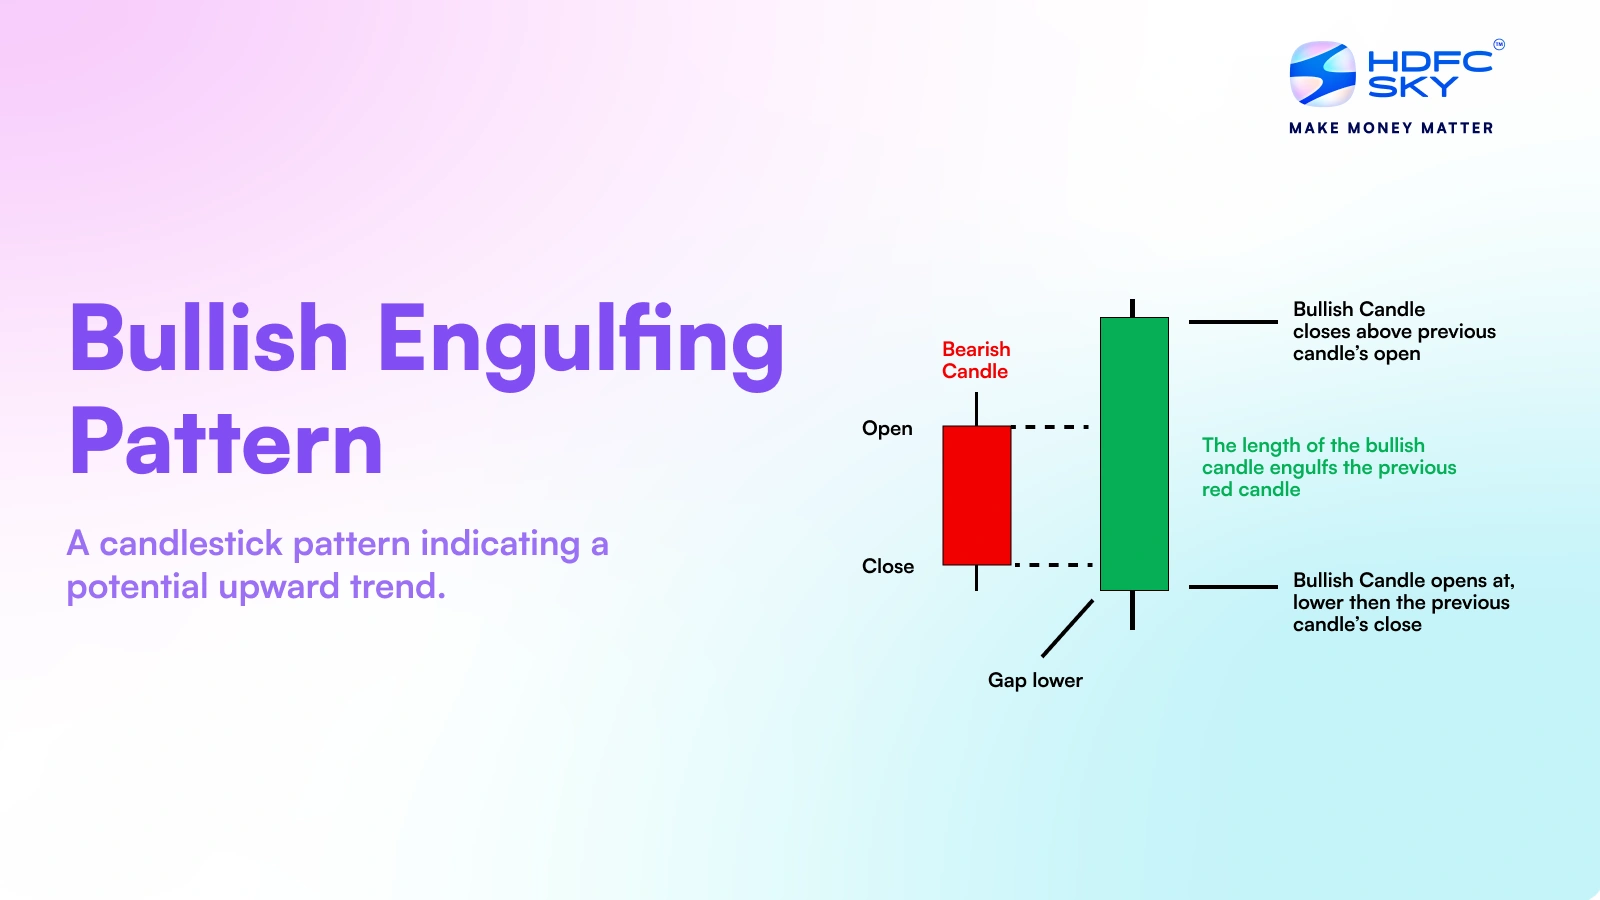
The Bullish Engulfing Pattern is one of the strongest bullish reversal signals in technical analysis. It typically appears after a downtrend and consists of two candles. The first candle is bearish, reflecting continued selling pressure, while the second candle is a large bullish candle that completely engulfs the body of the previous bearish candle.
This shift indicates that buyers have overwhelmed sellers, potentially marking the beginning of a new upward trend. The pattern becomes even more reliable when it forms near a major support level or after an extended decline.
📌 Trading Strategy
✅ Wait for the bullish candle to close.
✅ Enter on the next candle after confirmation.
✅ Place the stop-loss below the low of the engulfing candle.
✅ Aim for at least a 1:2 Risk-to-Reward Ratio.
🔴 Bearish Engulfing Pattern
Real Example
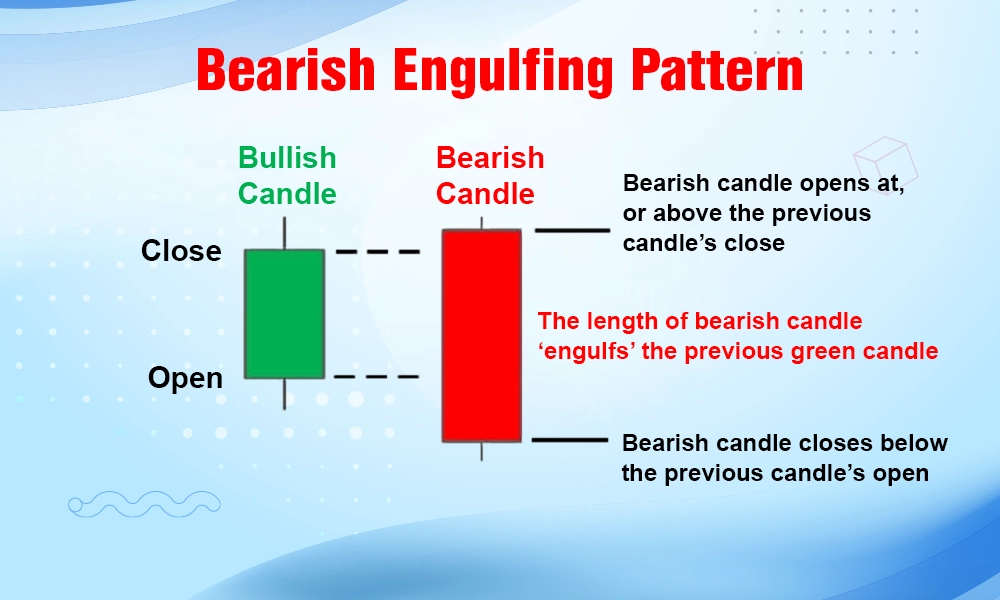
The Bearish Engulfing Pattern is the opposite of the Bullish Engulfing Pattern. It forms after an uptrend and signals that sellers may be taking control.
The first candle is bullish, showing buying momentum. The second candle is a large bearish candle that completely engulfs the body of the previous bullish candle. This sudden reversal suggests that buying strength has weakened and selling pressure has increased.
The pattern carries greater significance when it appears near resistance levels or after a prolonged rally.
📌 Trading Strategy
- Wait for confirmation with the next bearish candle.
- Consider entering a short trade after confirmation.
- Place the stop-loss above the high of the engulfing pattern.
- Use nearby support levels as potential profit targets.
⚠️ Avoid trading the pattern against a strong long-term uptrend without additional confirmation.
✨ Tweezer Top and Tweezer Bottom
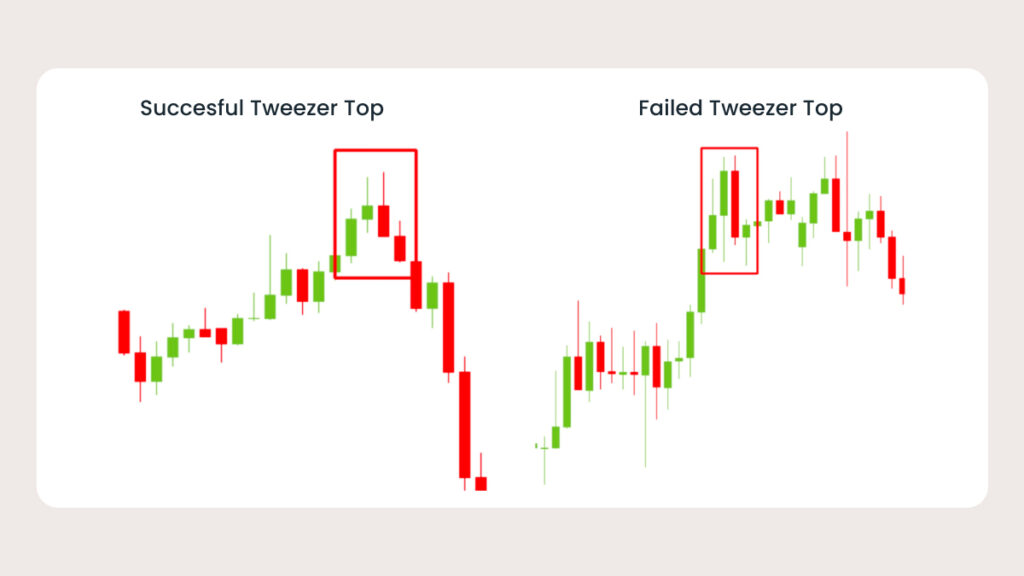
The Tweezer Top and Tweezer Bottom are reversal patterns formed by two candles that have nearly identical highs or lows.
A Tweezer Top appears after an uptrend. Buyers push the price to a new high on the first candle, but the second candle fails to move higher, showing that resistance is holding and sellers are beginning to take control.
A Tweezer Bottom appears after a downtrend. Sellers drive the price lower, but buyers step in at nearly the same low on the following candle. This repeated rejection of lower prices often signals the beginning of a bullish reversal.
Although these patterns are visually simple, they become far more reliable when combined with support and resistance levels and increased trading volume.
📊 Triple Candlestick Patterns
Single and double candlestick patterns provide valuable insights into market behavior, but triple candlestick patterns offer even stronger confirmation because they reveal price action over three consecutive trading sessions. These patterns help traders understand whether a trend is likely to continue or reverse by showing how buyers and sellers battle over a longer period.
Professional traders often trust triple candlestick patterns more than single-candle formations because they reduce the chances of false signals. However, no pattern guarantees success. The best results come when these formations appear near support and resistance levels, align with the overall market trend, and are confirmed by trading volume or technical indicators like RSI and Moving Averages.
If you can recognize these patterns correctly and combine them with proper risk management, they can become powerful tools in your trading strategy.
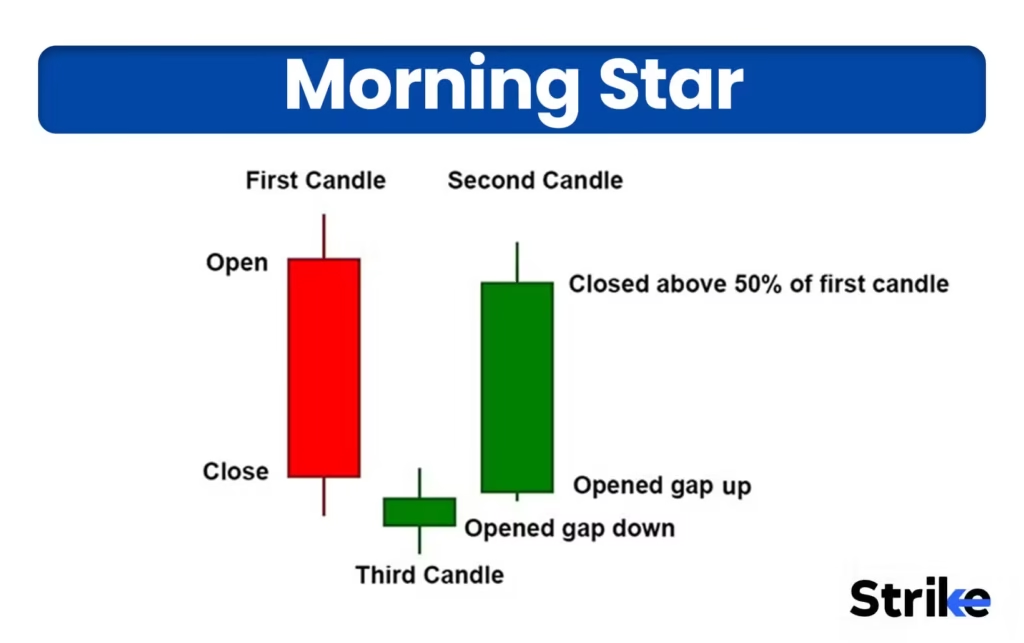
🌅 Morning Star Pattern
The Morning Star is one of the most reliable bullish reversal candlestick patterns. It usually appears after a strong downtrend and indicates that sellers are losing momentum while buyers are beginning to take control.
The pattern consists of three candles:
- 🔴 A large bearish candle
- ⭐ A small candle showing indecision (Doji or Spinning Top)
- 🟢 A strong bullish candle closing above the midpoint of the first candle
The first candle confirms that sellers dominate the market. The second candle reflects uncertainty, where neither buyers nor sellers have clear control. The third candle shows buyers stepping in aggressively, often marking the beginning of a new uptrend.
📈 How to Trade the Morning Star
✅ Wait for the third candle to close.
✅ Enter a Buy trade above the high of the third candle.
✅ Place the stop-loss below the lowest point of the pattern.
✅ Target the next major resistance level or maintain at least a 1:2 Risk-to-Reward Ratio.
💡 Pro Tip: A Morning Star pattern is most reliable when it forms at a major support zone with increasing trading volume.
🌇 Evening Star Pattern
The Evening Star is the bearish opposite of the Morning Star. It develops after an uptrend and often signals that buyers are losing strength while sellers are preparing to take control.
This pattern also consists of three candles:
- 🟢 Strong bullish candle
- ⭐ Small indecision candle
- 🔴 Large bearish candle
The first candle shows buyers confidently pushing prices higher. The second candle indicates hesitation, and the third candle confirms that sellers have taken control of the market.
📉 Trading Strategy
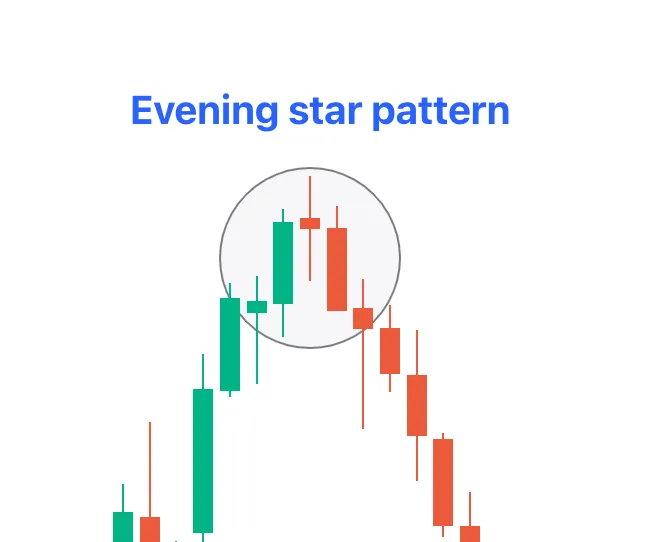
- Wait for the third candle to close below the midpoint of the first candle.
- Enter a Sell trade after confirmation.
- Place the stop-loss above the highest point of the pattern.
- Use the nearest support level as your first profit target.
⚠️ Avoid entering before the third candle closes. Premature entries often lead to false signals.
🛡️ Three White Soldiers
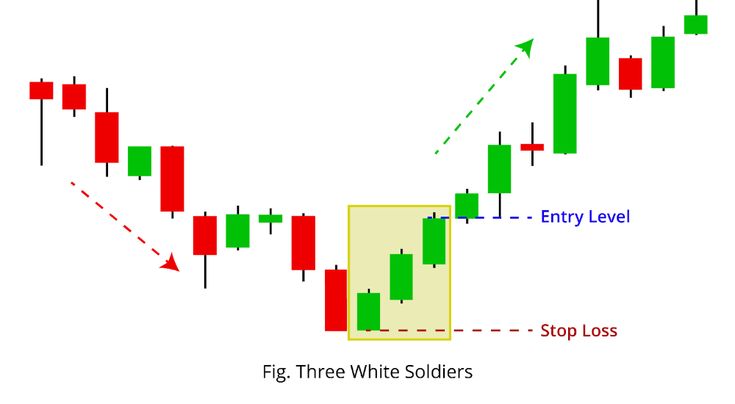
The Three White Soldiers pattern is considered one of the strongest bullish continuation and reversal patterns in technical analysis.
It forms after a downtrend or during the early stages of a trend reversal. The pattern consists of three consecutive long bullish candles, each closing higher than the previous one.
This formation demonstrates consistent buying pressure and growing market confidence. Buyers remain in control throughout all three trading sessions, making the pattern highly respected among professional traders.
📈 Trading Strategy
- Enter after the third bullish candle closes.
- Confirm the pattern using higher trading volume.
- Place the stop-loss below the first candle.
- Use resistance zones or trailing stop-loss methods to manage profits.
💡 Professional Insight: If the candles become unusually large after a prolonged rally, the market may be overextended. Wait for a pullback before entering.
⚔️ Three Black Crows
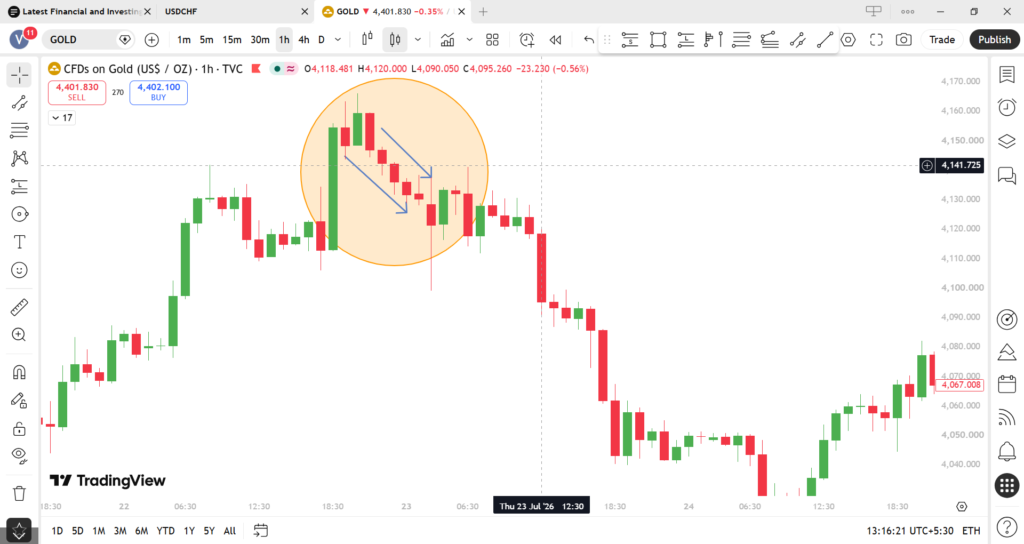
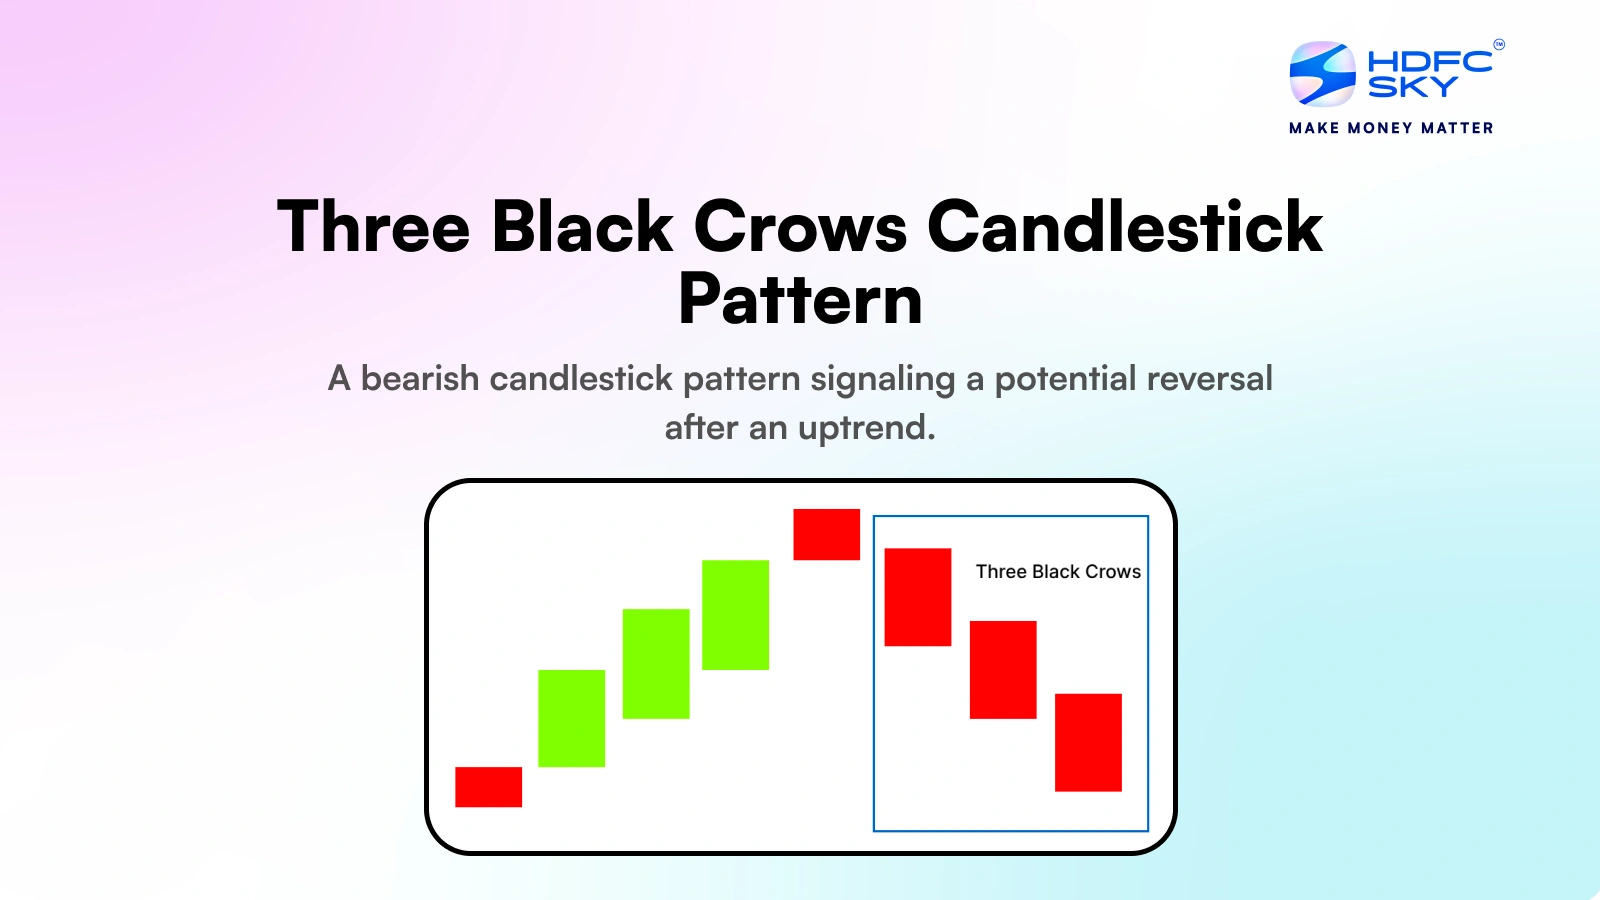
The Three Black Crows pattern is the bearish counterpart to the Three White Soldiers. It forms after an uptrend and consists of three consecutive bearish candles, each closing lower than the previous one.
This pattern signals that sellers have taken firm control of the market. It often appears before significant downward price movements, especially when accompanied by high trading volume.
The Three Black Crows pattern is widely used by swing traders and position traders to identify potential trend reversals.
📉 Trading Strategy
✅ Wait until all three candles have formed.
✅ Enter a Sell trade below the third candle.
✅ Place your stop-loss above the first candle.
✅ Aim for nearby support levels or use a trailing stop.
⚠️ Avoid entering if the pattern forms directly at a strong support zone, as buyers may step in quickly.
💰 Best Candlestick Trading Strategies
Learning candlestick patterns is only the beginning. Successful traders understand that no pattern works every time. The real edge comes from combining candlestick analysis with trend direction, support and resistance, technical indicators, and disciplined risk management.
One of the most effective approaches is to trade with the trend. Bullish patterns such as the Hammer or Bullish Engulfing have a higher probability of success during an uptrend, while bearish patterns like the Shooting Star or Bearish Engulfing perform better during a downtrend.
Another key principle is confirmation. Never enter a trade solely because a pattern appears. Wait for the next candle to confirm the move, and look for supporting evidence such as increased volume or an RSI reversal. This extra patience can significantly reduce false signals.
Finally, remember that capital preservation is more important than chasing profits. Even the best setup can fail. Professional traders risk only a small percentage of their account on each trade, allowing them to stay in the market long enough to benefit from high-probability opportunities.
💡 Golden Rule: Focus on quality trades, not the number of trades. Consistency comes from discipline, not from constant market activity.


One Comment