
The Relative Strength Index (RSI) is one of the most popular and versatile momentum oscillators used in technical analysis. Developed by J. Welles Wilder Jr. and introduced in his 1978 book New Concepts in Technical Trading Systems, RSI helps traders evaluate the speed and magnitude of recent price changes to identify overbought or oversold conditions in an asset.
Whether you are trading equities on the National Stock Exchange (NSE), index options on the Nifty 50, or positional swings in Bank Nifty, understanding how to read and apply the RSI indicator correctly can significantly sharpen your market timing.
What is the RSI Indicator in Trading?
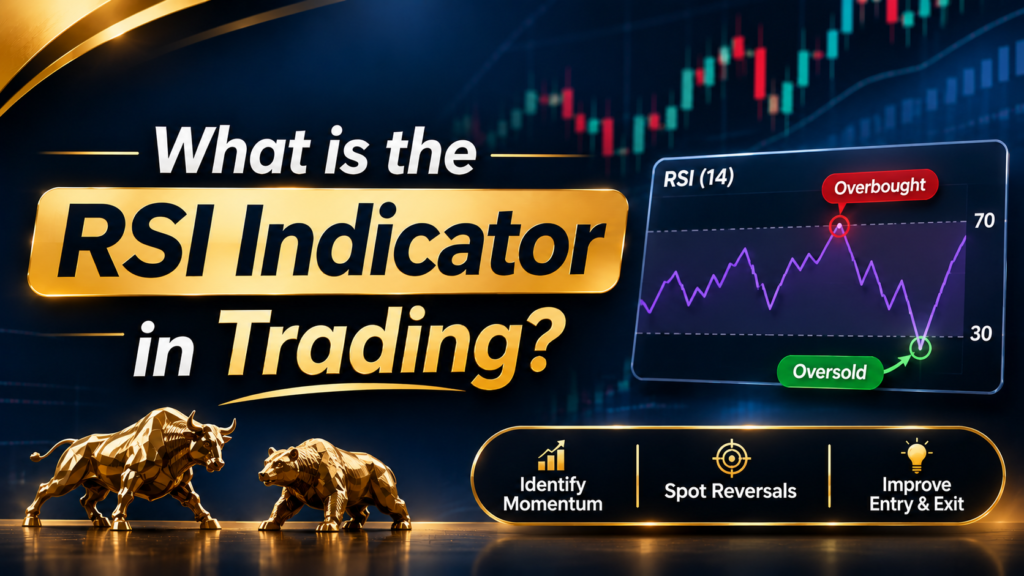
The RSI indicator in trading is a momentum oscillator that moves between 0 and 100. It measures whether recent price movements are predominantly bullish or bearish.
Unlike standard moving averages that track price direction directly, RSI calculates the ratio of upward price changes to downward price changes over a specified period. When prices rise rapidly, gains outpace losses, causing the RSI line to surge toward 100. Conversely, during heavy sell-offs, losses dominate, driving the RSI line down toward 0.
Traders use RSI to:
- Identify potential trend reversals when momentum exhausts.
- Confirm the strength of an ongoing trend.
- Spot divergence warnings before price action pivots.
- Pinpoint entry and exit zones in both intraday and positional setups.
The RSI Formula and Calculation Example
To truly master the Relative Strength Index, it helps to understand the underlying mathematics rather than treating it merely as a black box on your screen.
The Mathematical Formula
The RSI calculation is a two-step process:
- Calculate Relative Strength (RS):RS=Average Loss over n periodsAverage Gain over n periods
- Calculate RSI:RSI=100−(1+RS100)
For the very first calculation, Wilder used a simple moving average of gains and losses over n periods (typically 14). For subsequent calculations, a smoothed moving average formula is applied:
Current Average Gain=n(Previous Average Gain×(n−1))+Current Gain
Current Average Loss=n(Previous Average Loss×(n−1))+Current Loss
Worked Hypothetical Example (5-Period RSI)
Imagine a stock over a 5-day period with the following closing price changes:
- Day 1: +₹2.00 (Gain)
- Day 2: -₹1.00 (Loss)
- Day 3: +₹3.00 (Gain)
- Day 4: +₹1.50 (Gain)
- Day 5: -₹0.50 (Loss)
- Sum of Gains: 2.00+3.00+1.50=6.50Average Gain (n=5n=5n=5): 6.50/5=1.30
- Sum of Losses: 1.00+0.50=1.50Average Loss (n=5n=5n=5): 1.50/5=0.30
- Calculate RS:RS=0.301.30=4.333
- Calculate RSI:RSI=100−(1+4.333100)=100−(5.333100)=100−18.75=81.25
An RSI reading of 81.25 indicates that upward momentum has been heavily dominant over this 5-day sample.
Understanding RSI 14 Settings vs. 9 and 21
The RSI 14 settings represent the classic default configuration established by J. Welles Wilder. However, traders often experiment with alternative lengths like 9 or 21 depending on their trading style.
| RSI Setting | Sensitivity | Signal Frequency | Best Suited For | Risk Profile |
|---|---|---|---|---|
| RSI 9 | High | High (More Signals) | Short-term momentum, intraday scalping | Higher false-signal rate |
| RSI 14 | Balanced | Moderate | Swing trading, positional setups, general charting | Standard benchmark |
| RSI 21 | Low | Low (Fewer Signals) | Long-term positional trends, macro investing | Conservative, filters noise |
There is no universally “best” setting. Intraday traders in the Indian market often lean toward shorter settings (like RSI 9 or 10) to capture quick momentum bursts, whereas positional swing traders prefer RSI 14 or 21 to filter out market noise. If you want to explore how to combine indicator settings with price action, check out our guide on the best trading strategies for Indian traders.
Decoding Overbought and Oversold Levels
Traditionally, the RSI scale features two critical horizontal threshold lines:
- Overbought (Above 70): Suggests the asset’s price has risen rapidly and may be due for a pullback or consolidation.
- Oversold (Below 30): Suggests the asset has experienced aggressive selling pressure and could experience a bounce or relief rally.
Context Matters in Indian Markets
In strong secular bull markets (such as sustained rallies in Nifty 50 or mid-cap indices), stocks can remain overbought (RSI > 70) for extended periods. Selling purely because RSI hits 72 in a raging bull trend often leads to missing out on massive upside. Conversely, in strong bear trends, RSI can hover persistently below 30. Always read overbought and oversold readings alongside the broader market trend and price action.
Mastering RSI Divergence (Bullish & Bearish)
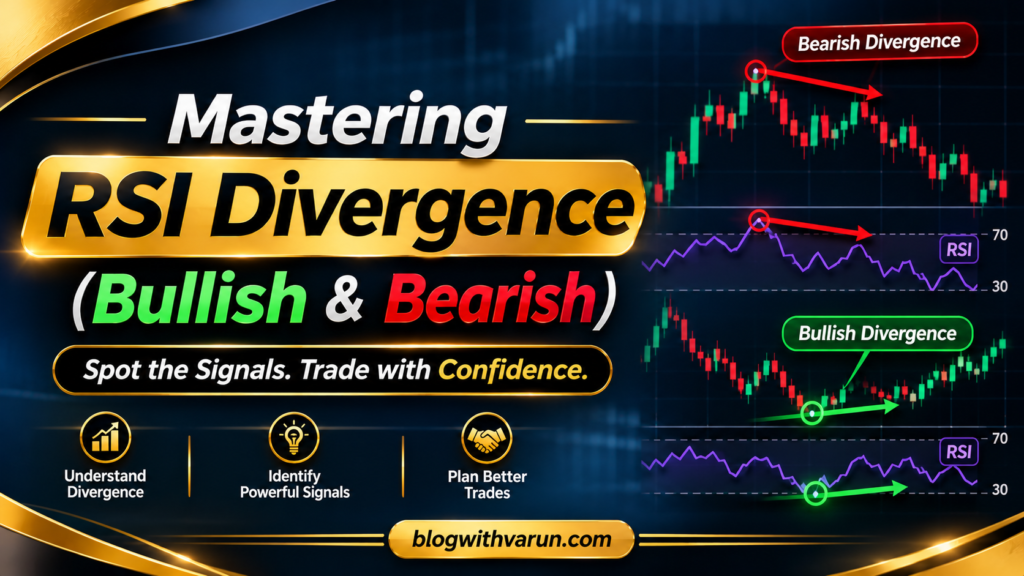
RSI divergence occurs when the movement of the RSI indicator contradicts the movement of the price chart. This is often one of the earliest warning signs of an impending trend reversal.
1. Bullish RSI Divergence
- Price Action: Forms Lower Lows (LL).
- RSI Action: Forms Higher Lows (HL).
- Interpretation: Even though the stock price is dropping to new lows, downward momentum is weakening. This signals that sellers are losing control and buyers may step in.
2. Bearish RSI Divergence
- Price Action: Forms Higher Highs (HH).
- RSI Action: Forms Lower Highs (LH).
- Interpretation: The price reaches a higher peak, but the momentum behind the move is fading. Buyers are running out of steam, increasing the probability of a bearish reversal.
To dive deeper into identifying and executing these specific reversal setups, read our complete tutorial on RSI divergence strategies.
Recommended TradingView Chart Illustrations:
- Illustration 1 (Bullish Divergence): Set up a TradingView chart for a stock like Reliance Industries on a daily timeframe, highlighting a price swing making lower lows while the RSI sub-chart prints rising troughs, followed by a sharp bullish breakout.
- Illustration 2 (Bearish Divergence): Examine an index chart (e.g., Nifty Bank on a 1-hour chart) displaying higher price peaks while the RSI indicator prints declining peaks right before a notable correction.
- Illustration 3 (False Signal during a Strong Trend): Showcase a strong trending stock where RSI enters overbought territory (>70) multiple times, showing bearish divergence prematurely while the stock continues an aggressive northward rally.
RSI Behavior in Trending and Sideways Markets
How you interpret RSI depends heavily on whether the market is trending or ranging:
- Sideways (Range-Bound) Markets: RSI works exceptionally well here. When prices oscillate between defined support and resistance, RSI reliably bounces between 30 and 70, making swing trading boundaries clear.
- Strong Trending Markets: In a robust uptrend, RSI shifts its operational range. Instead of dropping to 30, it often finds support around the 40–50 zone, while overbought readings (>70) stretch toward 80 or 90. In a strong downtrend, RSI resistance frequently caps out around the 50–60 zone.
RSI Failure Swings
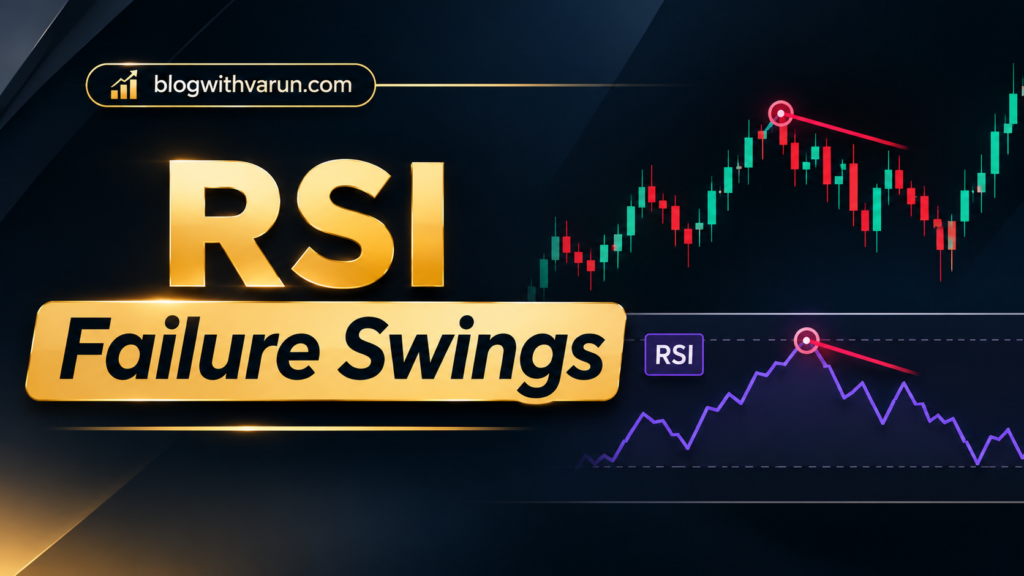
Popularized by Wilder, Failure Swings are powerful reversal signals that do not even require a direct divergence comparison with price action.
- Bullish Failure Swing:
- RSI drops below 30 (oversold).
- It bounces back up (forming a trough).
- It pulls back again, but stays above 30 (forming a higher bottom).
- RSI then breaks above its prior intermediate high. The breakout point signals a buy.
- Bearish Failure Swing:
- RSI surges above 70 (overbought).
- It pulls back down.
- It rallies again, but stays below 70 (forming a lower top).
- RSI breaks below its prior reaction low, signaling a short or exit point.
RSI Support and Resistance
Many traders overlook the fact that horizontal support and resistance lines, trendlines, and chart patterns (like triangles or channels) can be drawn directly onto the RSI sub-chart window.
When an RSI trendline breaks before the actual price trendline breaks, it acts as an early indicator of momentum shifting. Similarly, horizontal zones where RSI has repeatedly bounced or stalled in the past often act as reliable internal support and resistance levels.
Comparing RSI with MACD and VWAP
To build a high-probability RSI trading strategy, traders often combine RSI with other technical tools. Here is how RSI compares to MACD and VWAP:
| Feature | RSI (Relative Strength Index) | MACD (Moving Average Convergence Divergence) | VWAP (Volume Weighted Average Price) |
|---|---|---|---|
| Primary Focus | Momentum oscillator measuring speed of price changes | Trend-following momentum indicator based on moving averages | Intraday benchmark measuring average price weighted by volume |
| Indicator Type | Bounded oscillator (0 to 100) | Unbounded histogram and signal lines | Price-overlay benchmark line |
| Best Used For | Overbought/oversold levels, divergence, exhaustion | Trend direction, crossover signals, momentum shifts | Intraday fair value, institutional execution benchmark |
| Timeframe Suitability | Intraday, swing, positional | Swing, positional, medium-to-long term | Intraday trading exclusively |
For a detailed look at combining moving average convergence with momentum, check out our MACD indicator guide. If you trade intraday on Indian exchanges, learn how to pair RSI with institutional volume levels using our VWAP trading strategy guide.
Common RSI Trading Mistakes to Avoid
- Blindly Trading Overbought/Oversold Extremes: Selling a stock simply because RSI hits 75 in a strong bull run is a recipe for missed profits. Always check the macro trend.
- Ignoring Higher Timeframe Context: Taking a 5-minute RSI divergence signal against a powerful 1-hour or daily trend often results in failed trades.
- Using RSI in Isolation: Relying solely on RSI without checking volume, price action, or support/resistance zones increases exposure to false breakouts.
- Changing Settings Constantly: Constantly tweaking RSI periods based on past chart snippets leads to curve-fitting and poor real-world execution.
How False Signals Occur and Evaluating Confirmation
False signals are common in choppy, low-volume markets where price action whipsaws. For instance, an RSI bearish divergence might appear during a strong momentum breakout, trapping early short sellers.
How to Evaluate Confirmation:
- Candlestick Patterns: Look for confirmation candles (such as engulfing patterns, pin bars, or morning/evening stars) at key reversal levels.
- Volume Analysis: Ensure volume spikes support the reversal or breakout. Low-volume RSI signals are far more prone to failure.
- Moving Average Confluence: Confirm whether price action is holding above or below key exponential moving averages (like the 20 EMA or 50 EMA).
RSI Limitations and Risk Management
While RSI is an invaluable analytical tool, it has distinct limitations:
- Lagging Nature: Because RSI is calculated using historical price data, extreme readings can sometimes occur after a major move has already unfolded.
- Trend Persistence: In runaway markets, RSI can stay pinned in overbought or oversold territories for days or weeks.
Risk Management Best Practices
- Always Use Stop-Losses: Never enter a trade based on an RSI signal alone without defining a clear invalidation point on the price chart.
- Position Sizing: Risk no more than 1% to 2% of your trading capital on any single trade setup.
- Backtest Your Setup: Practice identifying these patterns across different market phases before deploying live capital in the Indian stock market.
Educational RSI Trading Checklist
Use this structured checklist before executing any trade based on the RSI indicator:
- [ ] Identify the Market Trend: Is the stock/index trending strongly or trading in a sideways range?
- [ ] Check RSI Value: Is the indicator approaching extreme zones (<30 or >70), or showing clear divergence?
- [ ] Look for Price Confirmation: Has price action formed a matching reversal pattern or broken a key support/resistance level?
- [ ] Evaluate Volume: Is volume supporting the potential breakout or reversal move?
- [ ] Define Risk and Reward: Where is your stop-loss placed, and is your target at least 1.5x to 2x your risk?
Author Box
Frequently Asked Questions (FAQs)
1. What is the best RSI setting for intraday trading in the Indian stock market?
While RSI 14 is the standard default, many intraday traders in India use RSI 9 or RSI 10 on 5-minute or 15-minute timeframes to capture quicker momentum shifts. However, shorter settings generate more noise and false signals.
2. Can RSI go above 100 or below 0?
No. Because the formula calculates the ratio of gains to losses on a normalized scale, RSI is strictly bounded between 0 and 100.
3. What does an RSI reading of 50 signify?
An RSI reading right around 50 indicates a neutral market momentum balance—neither buyers nor sellers hold a decisive advantage. In an uptrend, RSI often pulls back to test the 50 level as support before resuming its advance.
4. What is the difference between RSI and MACD?
RSI is a bounded momentum oscillator (0–100) great for spotting overbought/oversold extremes and divergence. MACD is an unbounded trend-following momentum indicator that uses moving average crossovers to signal trend direction and momentum changes.
5. Why does RSI give false signals during strong trends?
During powerful bull or bear trends, price momentum can remain overwhelmingly one-sided, causing RSI to stay in overbought (>70) or oversold (<30) territory for extended periods while the price continues moving in the direction of the trend.
6. How reliable is RSI divergence?
RSI divergence is a strong warning sign of momentum exhaustion, but it is not a standalone entry trigger. It should always be confirmed with price action, candlestick patterns, or support/resistance breaks before placing trades.