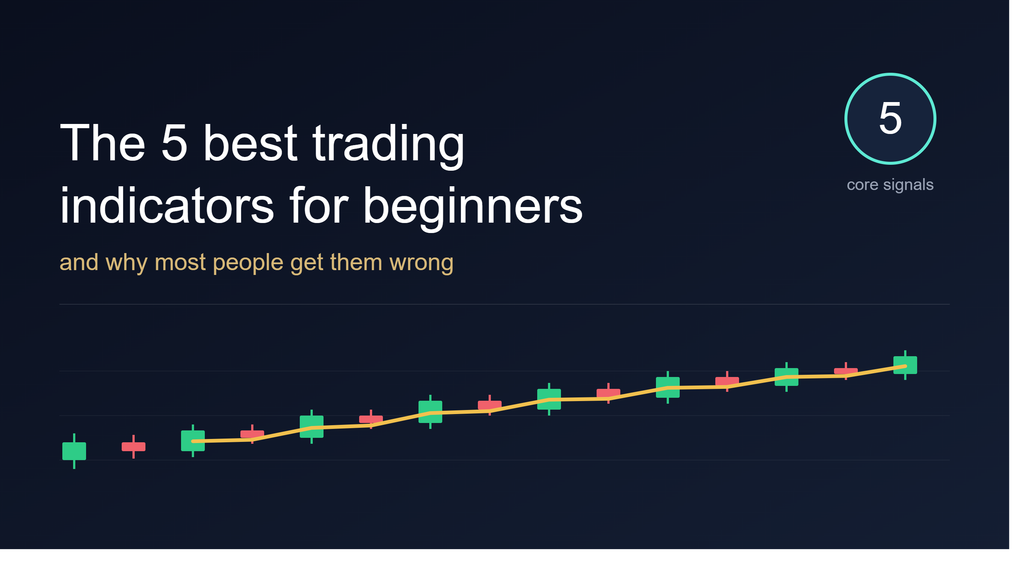
The 5 Best Trading Indicators for Beginners (And Why Most People Get Them Wrong)
You know that moment. You open a chart, and it’s got seven indicators fighting for space — three moving averages, an RSI, a MACD, some Bollinger Bands, maybe a Stochastic thrown in for good measure — and every single one of them is telling you something different. One says buy. One says wait. One’s flashing red like it’s personally offended by your entry price.
That’s not analysis. That’s noise. And it’s exactly the trap that keeps most beginners stuck at “almost profitable” for years.
Here’s the truth nobody tells you when you’re starting out: the best trading indicators for beginners aren’t the ones with the most settings to tweak. They’re the two or three that actually answer a question you care about — is this trending, and does it have momentum behind it? Everything else is decoration.
“I’m going to walk you through the five best trading indicators for beginners, and more importantly…”, and more importantly, how to combine just two of them into a system you can actually trust. Not because it’s a secret formula — it isn’t — but because simplicity is what survives contact with your own emotions when real money’s on the line.
Why More Indicators Don’t Mean Better Trades
Here’s something that took me embarrassingly long to learn: adding another indicator to your chart feels like adding safety. It isn’t. It’s usually just adding another voice to the argument in your head.
Psychologically, this is called analysis paralysis, and it’s got a nasty cousin called confirmation bias. You add the fourth indicator not because you need the data — you add it because part of you is hoping it’ll agree with the trade you already want to take. When it doesn’t, you don’t abandon the trade. You add a fifth indicator, looking for a tiebreaker. Sound familiar?
Every extra tool on your chart is a new place for doubt to hide. And doubt, in trading, doesn’t make you cautious. It makes you slow to act when you should be decisive, and fast to act when you should be sitting on your hands.
“So before we even get to the five best trading indicators for beginners, here’s rule one. fewer tools, used well, beat a cluttered chart every single time.
The Trend + Momentum Combo Behind the Best Trading Indicators for Beginners
Almost every profitable technical setup boils down to answering two questions:
Where’s the price headed? That’s trend.
How much fuel is behind the move? That’s momentum.
You genuinely don’t need more than that to get started. A trend tool tells you the direction you should even be looking to trade in. A momentum tool tells you whether the move has strength, or whether it’s running on fumes and due for a trend reversal. Stack those two together, and you’ve got a filter that quietly eliminates most of the bad trades beginners take out of boredom or impatience.
“Now let’s break down the five best trading indicators for beginners — and which two I’d actually build a strategy around.
1. Moving Averages — The Trend Backbone
“Moving averages are almost always the first entry on any list of the best trading indicators for beginners, and it’s not hard to see why.”
A moving average smooths out the chaos of day-to-day price action into a single line that tells you, at a glance, whether you’re in an uptrend, downtrend, or a sideways mess not worth trading. The two flavors you’ll run into are the Simple Moving Average (SMA), which weighs every price point equally, and the Exponential Moving Average (EMA), which leans harder on recent price action.
For beginners, I’d lean toward the EMA — a 20-period or 50-period EMA reacts fast enough to be useful without whipsawing you on every minor wiggle. Fidelity’s guide to moving averages is a solid primer if you want the mechanics spelled out.
The classic signal here is the moving average crossover — when a shorter EMA crosses above a longer one, it’s often read as the start of an uptrend; below, a downtrend. It’s not magic. It’s just a clean, visual way of asking “has momentum actually shifted, or is this a headfake?”
2. MACD — Trend and Momentum in One
MACD (Moving Average Convergence Divergence) is really two moving averages doing a dance. Subtract the 26-period EMA from the 12-period EMA, and you get the MACD line. Smooth that with a 9-period EMA, and you get the signal line. When the MACD line crosses above the signal line, that’s typically read as bullish; below, bearish.
What makes MACD genuinely useful — not just another squiggly line — is the histogram. It shows you the gap between those two lines widening or narrowing, which gives you an early read on whether momentum’s building or fading before the crossover even happens. TradingView’s breakdown of MACD is worth a slow read if you’re the type who likes to understand the machinery, not just the signal.
3. RSI — The Overbought/Oversold Gauge
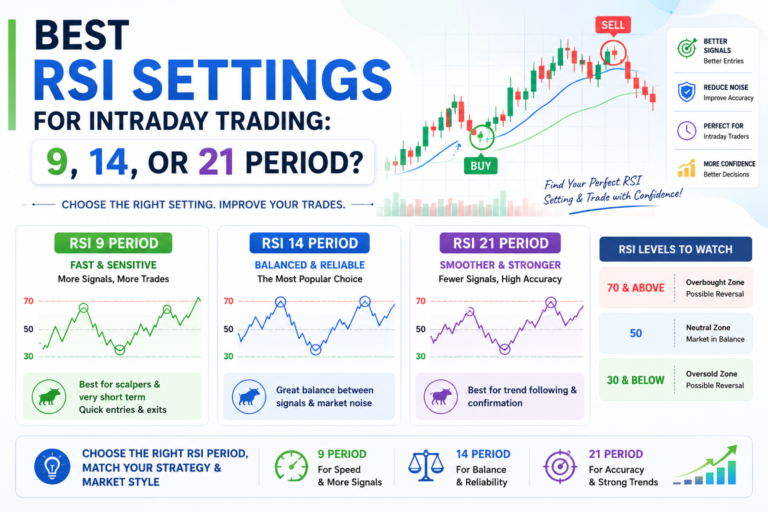
The Relative Strength Index measures how fast and how hard price has been moving, on a scale of 0 to 100. Cross above 70, and you’re in RSI overbought territory — the asset’s arguably run too far, too fast. Drop below 30, and it’s oversold, potentially due for a bounce.
Here’s where beginners get burned, though: RSI overbought does not mean “sell now.” In a genuinely strong trend, RSI can sit above 70 for weeks. Traders who short every overbought reading in a raging bull market get run over, repeatedly, and usually blame the indicator instead of their own interpretation of it. Fidelity’s RSI primer covers the calculation if you want to see exactly what’s under the hood.
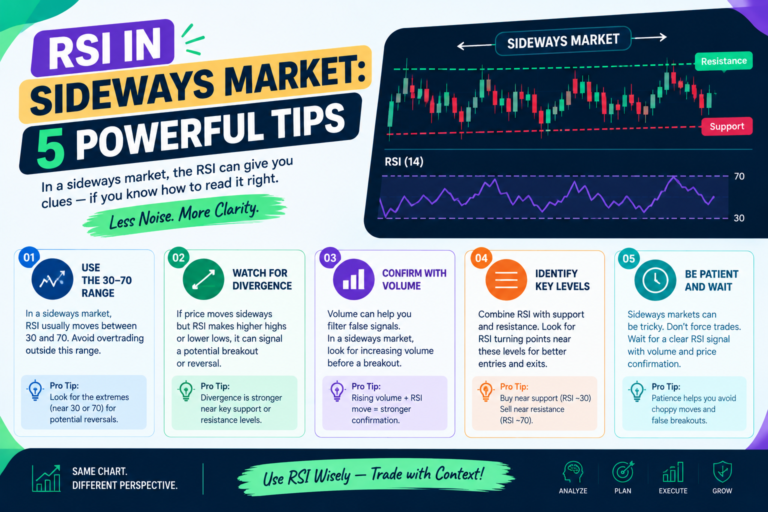
RSI shines brightest not as a standalone signal, but as a filter — and as a divergence tool, where price makes a new high but RSI doesn’t, hinting the move is losing steam underneath the surface.
4. Volume — The Confirmation Nobody Checks
Here’s an indicator most beginners scroll right past, and it might be the most honest one on the chart. Volume tells you how much conviction is actually behind a move. A breakout on high volume means real participation. A breakout on thin volume is often a trap — a move that looks real on the chart but has nobody actually behind it, and it can reverse just as fast as it appeared.
If you take away one thing from this section, let it be this: any signal from a trend or momentum indicator gets dramatically more trustworthy when volume confirms it.
5. Bollinger Bands — The Volatility Read
Bollinger Bands wrap a moving average in two bands set at a standard deviation above and below it. When the bands squeeze tight, volatility’s compressed and a big move is often brewing. When price rides the outer band, it can mean a strong trend — or an exhausted one about to snap back. Context matters more here than with almost any other tool on this list, which is exactly why it’s not the one I’d hand a total beginner first.
The Simple Combo: EMA + RSI
If I had to strip the best trading indicators for beginners down to one setup for someone just starting out, it’d be a 50-period EMA for trend, paired with RSI for momentum and timing. Here’s roughly how it plays out:
Price above the 50 EMA, and it’s sloping upward — you’re only looking for buy setups. Nothing else matters until that changes. Then you wait for RSI to dip toward the 40–50 zone on a pullback, not the deep oversold territory below 30, and turn back up. That’s your cue — a pullback within an established uptrend, not a bottom-fishing bet against it.
Notice what this does psychologically. It removes the guesswork of “is this a dip or a crash?” by anchoring you to the trend first. You’re not trying to catch falling knives. You’re waiting for the market to offer you a discount inside a trend that’s already proven itself.
The Psychological Trap Behind Every Indicator
Here’s the part almost nobody talks about, and it’s the part that actually determines whether you make money with these tools or just donate it to someone who does.
An indicator doesn’t fail you. Your reaction to it does.
When RSI flashes oversold, your brain doesn’t calmly process “statistically, a bounce is more likely here.” It processes fear — fear that it’ll keep falling, fear you’ll miss the bounce if you wait, fear of being wrong in front of, well, nobody, because trading is one of the loneliest activities there is. That fear pushes you to either freeze completely or jump in too early, doubling down before the actual reversal confirms.
And when a moving average crossover flips bullish after a stock’s already ripped 20%? That’s not analysis kicking in. That’s FOMO wearing analysis as a costume. Recall the 2022 tech sell-off — plenty of traders watched high-growth names get cut in half, saw an RSI bounce off oversold levels, and jumped back in on hope rather than confirmation, only to watch the downtrend resume for months. The indicator wasn’t wrong. The interpretation, rushed by fear of missing the bottom, was.
I’ve got my own version of that story — a MACD bearish crossover I talked myself out of respecting because I “just knew” the stock would recover, and watched a manageable loss turn into one I still think about. That’s not a fun lesson to learn with real capital. It’s a far cheaper one to learn from someone else’s mistake, which is honestly the whole point of writing this.
The indicators aren’t there to remove emotion from trading. Nothing does that completely. They’re there to give your emotions something more disciplined to argue with than a blank chart and a gut feeling.
Common Mistakes Beginners Make With These Indicators
Most of the mistakes people make with the best trading indicators for beginners aren’t about picking the wrong one — they’re about misusing a perfectly good one.”
Piling on five or six indicators until you find one that agrees with the trade you’ve already decided to take — that’s confirmation bias with extra steps. Treating RSI overbought as an automatic sell signal in a strong uptrend, instead of context to weigh, is another classic. So is dropping your TradingView scalping setup down to the 1-minute chart before you’ve even proven the strategy works on a daily timeframe — more noise, more false signals, more chances to second-guess yourself into a bad exit.
“And maybe the biggest one, even among people using the best trading indicators for beginners correctly on paper: changing your indicator settings after every losing trade, hunting for the “perfect” parameters, instead of accepting that no combination of numbers removes risk entirely. There isn’t a setting that turns a probability-based tool into a certainty.
How to Actually Practice This
Don’t skip this part just because it’s not as exciting as picking indicators — knowing the best trading indicators for beginners means nothing without the practice habits to back it up.
Start on a demo account, or paper trade, on the daily or 4-hour chart before you ever touch a 5-minute scalp setup. Slower timeframes give you cleaner signals and far more time to think before you act.
Backtest your EMA + RSI combo across at least 50 historical setups before risking real money. You want to be trusting data, not a hunch.
Risk a fixed, small percentage of your account per trade. Most experienced traders land somewhere around 1% — enough that a string of losses doesn’t wipe you out while you’re still learning the rhythm of your own reactions.
And keep a trading journal. Log not just entry and exit, but what you were feeling when you clicked the button. That log will teach you more about your own weaknesses than any indicator ever will.
Final Thoughts
You don’t need fifteen indicators to trade well. You need two that answer real questions, the discipline to wait for both to agree, and enough self-awareness to notice when fear or greed is doing the “analysis” instead of you. The best trading indicators for beginners are simply the ones you understand deeply enough to trust — and simple enough that you’ll actually use them the same way, trade after trade, instead of reinventing your strategy every time the market makes you nervous.
Master a trend line and a momentum reading before you chase anything fancier. Everything else is noise until you’ve earned the right to add it.
Internal Link Placeholders
- In the RSI section (3):
- In the “How to Actually Practice This” section: [article on risk management]
- In the Moving Averages section (1): [ candlestick charts]
External Link Placeholders
- Moving Averages section → Fidelity: Moving Average guide
- MACD section → TradingView: MACD explained
- RSI section → Fidelity: RSI technical indicator guide