
RSI divergence BankNifty options setups look simple on a chart, which is exactly why they trap so many traders.
Written by a SEBI Registered Research Analyst with 5+ years of live trading experience in Indian equity and derivatives markets. This post is educational and does not constitute investment advice.
Last year, a trader I mentor lost nearly 40% of his capital in three weeks. He bought every oversold signal because the chart “looked due” for a bounce. In a strong downtrend, RSI can stay below 30 for days while BankNifty keeps falling.
This post explains how I use RSI divergence BankNifty options setups, the exact rules behind each trade, and what my 5-year backtest showed, including the periods where it failed.
RSI Divergence BankNifty Options: What the Signal Tells You
RSI (Relative Strength Index) measures the speed and size of recent price moves on a scale of 0 to 100. Divergence appears when price and RSI disagree.
- Bullish divergence: Price makes a lower low, but RSI makes a higher low. Selling momentum is weakening.
- Bearish divergence: Price makes a higher high, but RSI makes a lower high. Buying momentum is fading.
In RSI divergence BankNifty options trading, the key word is weakening. Divergence does not predict a reversal on its own. It signals that the current move is losing force, which is why I never trade it without a confirmation trigger.
The RSI Divergence BankNifty Options Strategy: Core Parameters
These are the settings I use for RSI divergence BankNifty options across both intraday and swing trades.
Indicator Settings
- RSI period: 14
- Signal timeframe: 15-minute chart for intraday setups
- Confirmation timeframe: 5-minute chart for entry timing
- Swing version: Daily chart with RSI(14), holding positions 3 to 7 days
Market Filters
I only take a trade when:
- BankNifty is past the first 15 minutes after the open (after 9:30 AM).
- No major RBI policy announcement or Union Budget event falls within the session.
- The signal forms before 2:00 PM, which leaves time for the trade to develop.
Step-by-Step Rules for RSI Divergence BankNifty Options
Every RSI divergence BankNifty options trade follows the same sequence. If any step is missing, I skip the trade.
Bullish Setup (Buying Calls)
- Find the swing lows. On the 15-minute chart, locate two swing lows where the second is lower than the first.
- Check RSI. RSI at the second low must be higher than at the first. Both readings should be below 40.
- Wait for confirmation. On the 5-minute chart, enter only after a candle closes above the high of the reversal candle, and RSI crosses back above 30.
- Select the strike. Buy the ATM or one-strike OTM call. Avoid deep OTM options, since their low premiums hide poor risk-reward.
- Set the stop-loss. Exit if BankNifty closes below the swing low, or if the option premium falls 25% from entry, whichever comes first.
- Set the target. Exit half the position at 1:1.5 risk-reward. Trail the rest using the 5-minute swing low.
Bearish Setup (Buying Puts)
Mirror the logic. Look for a higher high in price with a lower high in RSI, RSI below 70 at the peak, and a confirmation candle closing below the reversal candle’s low as RSI crosses below 70.
Exit Rules
- Hard stop at the premium or underlying level, whichever triggers first.
- Time stop: close intraday positions by 3:00 PM regardless of P&L.
- Expiry rule: I don’t hold long options into expiry unless the setup is a clean swing signal from the prior week.
Risk Management for RSI Divergence BankNifty Options

Most losses in RSI divergence BankNifty options trading come from position size, not from the signal itself.
The 1% Rule
I risk no more than 1% of trading capital on any trade. On a ₹5 lakh account, that caps the loss at ₹5,000 per trade.
Calculating Lot Size
- Set your exit premium (entry premium × 0.75 for a 25% stop).
- Calculate the loss per lot (premium difference × lot size).
- Divide your maximum risk by the loss per lot.
Illustrative example: If the option is at ₹200, the stop is at ₹150, and the lot size is 30, the loss per lot is ₹50 × 30 = ₹1,500. A ₹5,000 limit allows 3 lots, but I’d take only 1 or 2 to leave room for slippage. Check the current lot size on the NSE website before calculating, since exchange lot sizes change.
Daily and Monthly Limits
- Maximum 2 trades per day. After two losses, I stop for the day.
- Monthly drawdown limit: If the account drops 6% in a month, I halve position size until the next month.
5-Year Backtest of RSI Divergence BankNifty Options
I tested RSI divergence BankNifty options setups on 15-minute data from [START DATE] to [END DATE], applying the rules above with [SLIPPAGE/BROKERAGE ASSUMPTIONS].
- Total trades: [NUMBER]
- Win rate: [X%]
- Average winner vs. average loser: [RATIO]
- Maximum drawdown: [X%]
- Best year: [YEAR, RESULT]
- Worst year: [YEAR, RESULT]
What the Backtest Does Not Show
A backtest is a look backward, not a forecast. Three limitations matter:
- Historical premium data is approximate. It often lacks accurate bid-ask spreads, which affects real fills.
- Market conditions change. The strategy performed [describe] in trending markets and [describe] in sideways, high-volatility phases.
- Past results do not guarantee future returns.
For context on how individual F&O traders have fared, read the SEBI study on F&O trading outcomes. It found that most individual traders in the segment lost money, which is why I treat any options strategy as unproven until it has been tested on real capital with strict limits.
Real Chart Example: RSI Divergence BankNifty Options in Action
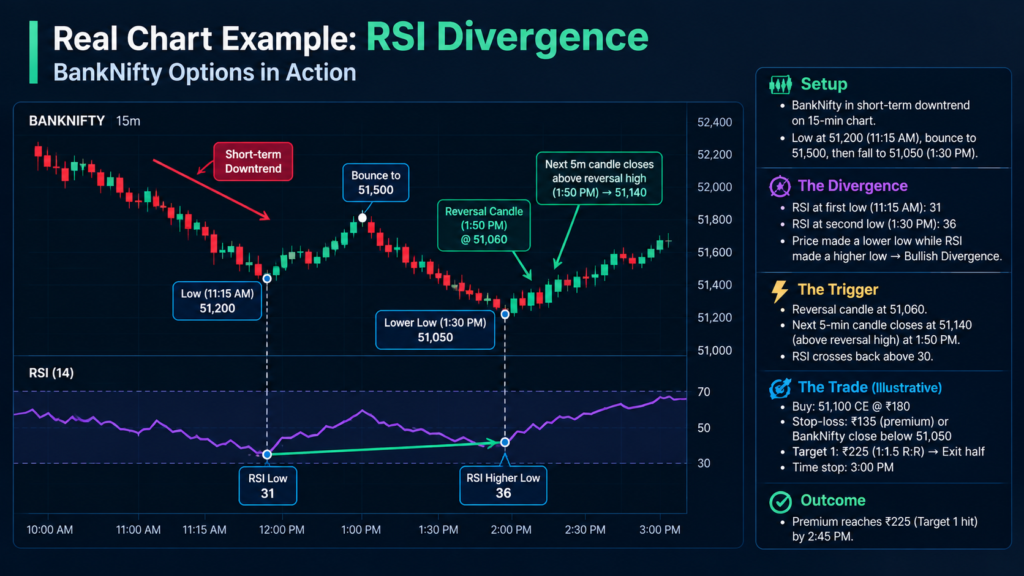
This is a hypothetical illustration of the rules, not a recommendation or a real trade.
Setup: BankNifty is in a short-term downtrend on the 15-minute chart. It makes a low at 51,200 at 11:15 AM, bounces to 51,500, then falls to 51,050 at 1:30 PM.
The divergence:
- RSI at the first low (11:15 AM): 31
- RSI at the second low (1:30 PM): 36
- Price made a lower low while RSI made a higher low. This is bullish divergence.
The trigger: A reversal candle forms at 51,060. At 1:50 PM, the next 5-minute candle closes at 51,140, above the reversal high, and RSI crosses back above 30.
The trade (illustrative):
- Buy the 51,100 CE at ₹180
- Stop-loss: premium at ₹135, or a BankNifty close below 51,050
- Target 1: ₹225 (1:1.5 risk-reward), exit half
- Time stop: 3:00 PM
Outcome: The premium reaches ₹228 by 2:40 PM. Half the position exits at target, and the rest exits at ₹215 when momentum fades.
What to note: Even in a clean setup, the trade required patience through the 11:15 AM low and the 1:30 PM retest. Traders who enter on the second low without confirmation are the ones who get stopped out.
Common Pitfalls in RSI Divergence BankNifty Options Trading
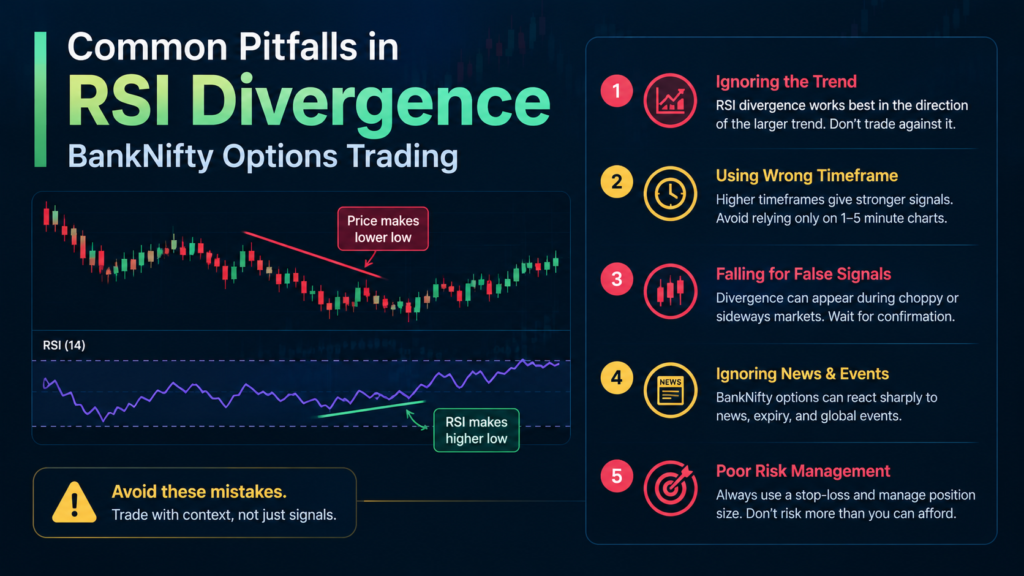
1. Trading divergence without confirmation.
Divergence can persist for several candles before price reverses. Always wait for the confirmation candle and the RSI cross. For background on the indicator itself, see my RSI(14) basics guide (replace with your actual URL).
2. Ignoring the higher-timeframe trend.
Bullish divergence inside a strong daily downtrend fails more often. If the daily chart is making lower lows with no sign of stabilizing, I take only bearish setups or skip the trade.
3. Oversizing after a winning streak.
After three wins, many traders double their lot size, and one bad trade wipes out the gains. Keep the 1% rule fixed regardless of recent results.
4. Holding options into the close.
Theta decay accelerates in the final hours. A trade that is right on direction can still lose money if you miss the 3:00 PM time stop.
Frequently Asked Questions About RSI Divergence BankNifty Options
Q1: What is the best RSI setting for RSI divergence BankNifty options?
RSI(14) on the 15-minute chart works well for intraday setups. RSI(9) generates more false signals in BankNifty’s volatility, and longer periods react too slowly for intraday option trades.
Q2: Can RSI divergence alone be used for BankNifty options?
It should not be. Divergence identifies a potential reversal. Without a confirmation candle, an RSI cross, and a strict risk limit, you are guessing on direction. My position sizing guide (replace with your actual URL) explains how to set those limits.
Q3: How much capital do I need for RSI divergence BankNifty options?
It depends on the current lot size and option premium. The more useful question is whether your account can absorb several consecutive losses at 1% risk per trade without affecting your decisions.
Q4: Is RSI divergence profitable on BankNifty?
My backtest produced [RESULT] over 5 years, but results vary by market regime and execution quality. Paper trade the setup for at least 30 days before committing real money.
Conclusion: Key Takeaways for RSI Divergence BankNifty Options
- RSI divergence signals a weakening trend, so wait for a confirmation candle and an RSI cross before acting.
- Position size matters more than the signal. Risk no more than 1% per trade and cap daily trades at two.
- Backtests show what worked in the past, not what will work next. Paper trade for at least 30 days first.
If you want the full rulebook, including the swing version and my trade journal template, subscribe to the newsletter (replace with your actual URL). If you have tested a version of this strategy yourself, share your results in the comments.
Disclaimer: This blog is for educational purposes only. Always manage your risk according to your personal financial goals.