Doji Candlestick Pattern: What It Means and How to Trade It
What is a Doji Candlestick Pattern?
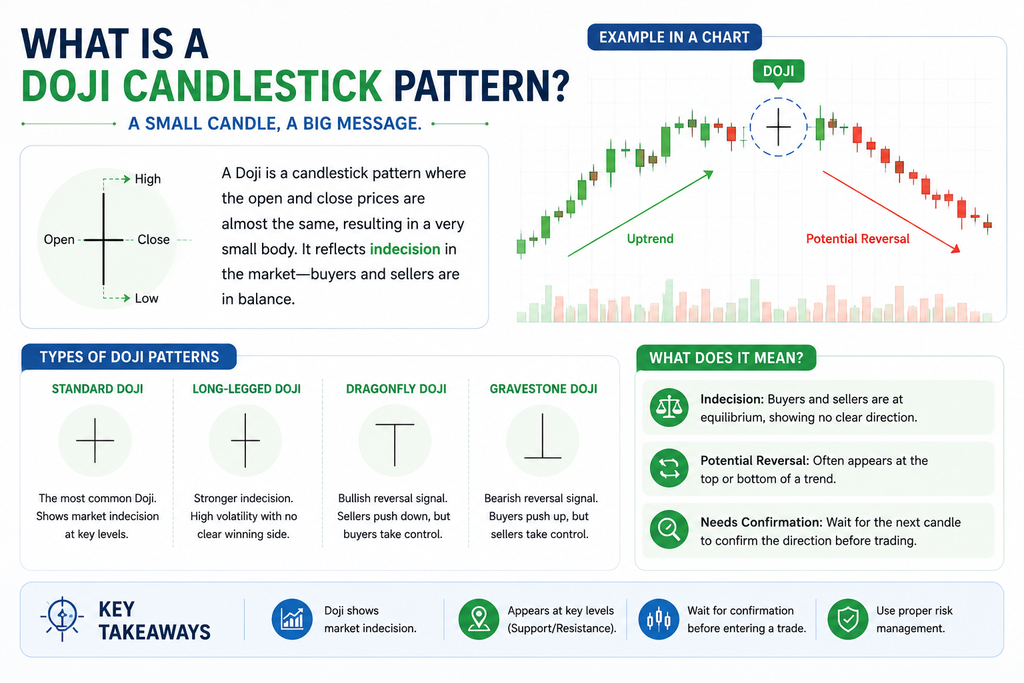
When you are learning technical analysis in the Indian stock market, the Doji candlestick pattern is one of the most critical reversal indicators you can master. A Doji candlestick pattern forms when a stock’s opening price and closing price are almost exactly the same. On your trading chart, it looks like a cross, a plus sign, or an inverted “T”.
This pattern signals one specific thing: total indecision. During that specific timeframe, buyers tried to push the price up, sellers tried to push it down, but neither side won. They fought to a draw, and the price closed right where it started.
When you spot a Doji candlestick pattern after a long uptrend or a steep downtrend, it’s a major warning sign. It tells you that the current trend is losing momentum and a profitable trend reversal might be right around the corner.
The 4 Types of Doji Candlestick Pattern Formations
Not all Dojis mean the exact same thing. Depending on where the open and close happen in relation to the high and low of the session, technical analysis categorizes the Doji candlestick pattern into four distinct types:
| Type of Doji | Visual Shape | What It Means | Best Traded As |
| Standard Doji | A perfect plus sign (+). | Extreme indecision. Neither bulls nor bears have any conviction. | A pause in the market; wait for the next candle. |
| Long-Legged Doji | A cross with very long wicks. | High volatility but zero net movement. A fierce battle happened. | A strong warning that the current trend is exhausted. |
| Dragonfly Doji | Looks like a “T”. | Sellers pushed down hard, but buyers aggressively bought the dip. | A bullish reversal signal at a support level. |
| Gravestone Doji | Looks like an inverted “T”. | Buyers pushed up, but sellers aggressively shorted it down. | A bearish reversal signal at a resistance level. |
How to Trade the Doji Candlestick Pattern (Bank Nifty Example)
Understanding the theory won’t make you money—knowing exactly how to execute a trade based on a Doji candlestick pattern will. Let’s look at a practical setup using the Bank Nifty index.
Imagine Bank Nifty has been in a strong uptrend, rallying to a psychological resistance zone at 46,200. On the 15-minute chart, the index pushes up to 46,250, but immediately faces selling pressure and closes right back where it opened—printing a textbook Gravestone Doji candlestick pattern.
Here is how you actually trade this price action:
Set a Logical Target: Aim for the nearest support level or use a standard 1:2 Risk-to-Reward ratio.
Wait for the Trigger Candle: The pattern only indicates indecision, not a confirmed reversal. You must wait for the very next 15-minute candle. If this next candle breaks below the low of the Doji, the sellers have taken control.
Execute the Entry: Enter your short position (buying Puts or shorting futures) the moment the price crosses below the Doji’s bottom wick.
Place a Strict Stop-Loss: Place your stop-loss slightly above the upper wick of the Doji candlestick pattern. If the price breaks above this wick, your reversal theory is wrong.
The Biggest Mistake Beginners Make with the Doji Candlestick Pattern
The single most common way new traders lose money with the Doji candlestick pattern is by trading it in a sideways, choppy market.
If Reliance Industries has been bouncing between ₹2,900 and ₹2,920 all day, printing this pattern in the middle of that range means absolutely nothing. A Doji simply means indecision. If the market is already chopping sideways, the Doji candlestick pattern is just confirming what you already know: the market is flat.
Expert Rule of Thumb: The Doji candlestick pattern is only highly profitable if it forms at the extreme end of an established trend, specifically right at a key Support or Resistance level. If you see it in the middle of a chart with no clear trend, ignore it completely.
Morning Doji Star and Evening Doji Star Candlestick Patterns: How to Trade Reversals
The Morning Doji Star and Evening Doji Star candlestick patterns are three-candle formations that signal a high-probability trend reversal. While standard Morning or Evening Star patterns have a small “spinning top” middle candle, the Doji Star variant is much more aggressive. It replaces that middle candle with a perfect Doji—a session where the opening and closing prices are exactly the same.
This subtle difference matters. A standard small-bodied candle shows fading momentum; a Doji shows absolute, sudden indecision. When this total deadlock happens at the extreme end of a trend, the subsequent snapback is usually violent.
Here is exactly what these patterns look like and how to trade them in the Indian market.
How to Identify Support and Resistance Levels in Nifty & Bank Nifty
The Morning Doji Star (Bullish Reversal)
You will only look for a Morning Doji Star at the bottom of a prolonged downtrend or right at a major support level. It signals that the bears have exhausted their selling power and the bulls are taking control.

Volume Analysis in Stock Trading: How to Spot Institutional Activity
The pattern consists of three specific candles:
- Candle 1: A long bearish (red) candle. The sellers are fully in control, driving the price lower.
- Candle 2: A Doji that ideally “gaps down” below the close of the first candle. This shows the sellers tried to push lower, but buyers stepped up perfectly to force a tie.
- Candle 3: A long bullish (green) candle that pushes back up, closing at least halfway into the body of the first red candle.
The Evening Doji Star (Bearish Reversal)
The Evening Doji Star is the exact opposite. You look for this pattern at the top of an uptrend or right at a major resistance zone. It tells you the buyers have run out of cash, and sellers are stepping in to short the market.
Here is the three-candle breakdown:
- Candle 1: A long bullish (green) candle. The trend looks strong and buyers are confident.
- Candle 2: A Doji that “gaps up” above the close of the first candle. The buyers tried to continue the rally, but aggressive sellers met them head-on.
- Candle 3: A long bearish (red) candle that closes deep into the body of the first green candle, confirming the reversal.
How to Trade the Doji Star Patterns (Nifty 50 Example)
Knowing the pattern is easy; executing the trade requires discipline. Let’s look at a realistic bearish reversal using the Nifty 50 index.
Imagine Nifty has rallied sharply for four days, approaching a major psychological resistance level at 24,000. On the daily chart, Nifty prints a massive green candle. The next day, it gaps up to open at 24,050, swings around wildly, but closes exactly at 24,050—printing your Doji. On day three, a massive red candle forms, closing well below 23,900. You now have a confirmed Evening Doji Star.
Here is how you execute the short trade:
1.Wait for the Pattern to Close:Never front-run the third candle.
A Doji at resistance is a warning, not a sell signal. You must wait for the third candle (the long red candle) to fully close. If you enter early and the third candle turns green, you are caught in a breakout trap.
2.Execute on the Break of Candle 3:
Enter your short position (e.g., buying Put options or shorting futures) when the price breaks below the low of the third confirming candle.
3.Place a Hard Stop-Loss:Protect your capital.
Place your stop-loss just above the highest wick of the Doji (the middle candle). If Nifty crosses above that Doji’s high, the bearish reversal is void. Exit immediately.
4.Trail Your Stop for Profits:
Target the nearest swing low or previous support level. Once Nifty drops by an amount equal to your initial risk (1:1 Risk/Reward), trail your stop-loss to break-even.
The Trap: Where Most Traders Get It Wrong
The fastest way to lose money trading Doji Stars is ignoring volume on the third candle.
Many beginners see the three-candle shape and blindly take the trade. But if that third confirming candle (the long green one for a Morning Star, or the long red one for an Evening Star) forms on low trading volume, it is a fakeout.
Expert Rule of Thumb: For the reversal to be genuine, the third candle must show a significant volume spike compared to the Doji candle. High volume on the third candle proves that institutional money has actually stepped in to force the market in the new direction. If the volume is flat, the trend is likely just pausing before continuing its original path.
Next Steps for Your Trading Plan: Do not trade Doji Stars in the middle of a choppy, sideways market—they only work at the extreme edges of clear trends. Start looking at your charts and pair these patterns with an oscillator like the RSI. If you spot an Evening Doji Star while the RSI is flashing “Overbought” (above 70), you have a high-probability trade on your hands.
Advanced Doji Candlestick Pattern Setups: The Morning and Evening Stars
Beyond the single-candle formations, the Doji candlestick pattern is also the crucial middle component of three-candle reversal setups known as the Morning Doji Star (a bullish reversal at the bottom of a downtrend) and the Evening Doji Star (a bearish reversal at the top of an uptrend). These multi-candle patterns offer some of the highest-probability trading setups in the Indian stock market when combined with volume confirmation.
Relative Strength Index (RSI): Complete Guide for Beginners
Recommended reading to master reversals:
- How to Combine Candlestick Patterns with RSI for Perfect Entries
- Understanding Gap Up and Gap Down Openings in the Indian Market
- The Difference Between a Pullback and a Trend Reversal
External Resources to Deepen Your Knowledge
- Zerodha Varsity: Technical Analysis Module: Widely considered the gold standard for self-taught Indian investors, this completely free resource offers a thorough breakdown of single and multiple candlestick patterns, including Dojis and Marubozus. It is essential reading for mastering the underlying logic of the market.
- NSE India Technical Analysis Courses: The National Stock Exchange (NSE) provides dedicated learning resources and formal certification programs covering Japanese candlesticks, momentum indicators, and support/resistance theories. It is a great place to formalize your education straight from the source.
- TradingView India (Community Scripts & Ideas): While your broker’s terminal is fine for execution, TradingView’s community section allows you to study how experienced traders are actively charting Doji and Star patterns on real-time Nifty and large-cap stocks. Seeing others draw these setups in live markets is invaluable for practical learning.