Price Action Trading

Price Action Trading: The Complete Beginner’s Guide to Consistent Profits in the Stock Market (2026)
What Is Price Action Trading?
If you have ever looked at a stock chart and wondered how experienced traders seem to predict market movements without filling their screens with dozens of indicators, the answer often lies in price action trading. Price action is one of the most respected trading methodologies because it focuses on what matters most—the actual movement of price. Instead of relying heavily on lagging indicators, price action traders study candlesticks, trends, support and resistance, and overall market structure to make trading decisions. Every price movement reflects the battle between buyers and sellers, and by learning to read these movements, traders gain valuable insights into market sentiment.
One of the biggest reasons price action trading has become so popular is its simplicity. Many beginners believe that adding more indicators increases accuracy, but experienced traders often discover the opposite. A clean chart allows them to interpret price more clearly without conflicting signals. Whether you trade stocks, commodities, forex, or indices, price action principles remain largely the same because human psychology drives every financial market. Fear, greed, optimism, and uncertainty appear repeatedly on charts, creating recognizable patterns that traders can use to identify high-probability opportunities.
Price action is not a shortcut to guaranteed profits. Instead, it is a framework that helps traders make disciplined decisions based on objective market behavior. Successful traders understand that no strategy wins every trade. Their goal is not perfection but consistency. By combining technical analysis with proper risk management, they improve the probability of long-term success rather than chasing unrealistic expectations.
Why Traders Prefer Price Action
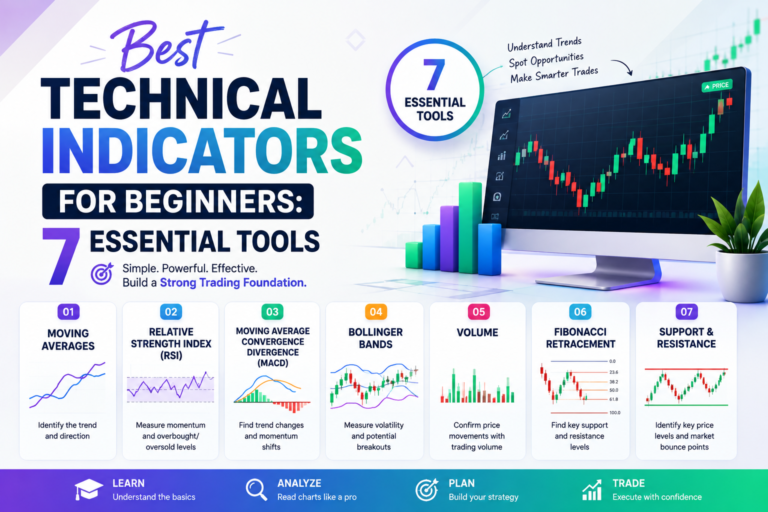
There are countless technical indicators available today, from RSI and MACD to Bollinger Bands and moving averages. While these tools can be useful, they all derive their signals from historical price data. Price action traders choose to focus directly on the source of that information—the price itself. This approach reduces chart clutter and helps traders react more quickly to changing market conditions.
Another major advantage is flexibility. Price action works across multiple timeframes, making it suitable for intraday traders, swing traders, positional traders, and even long-term investors. The same concepts that identify a trend on a five-minute chart can also be applied to daily or weekly charts. This universality makes price action one of the most versatile trading methods available.
Price action also improves decision-making by encouraging patience. Instead of entering trades whenever an indicator flashes a signal, traders wait for confirmation through price behavior. This often leads to better entries, improved risk-to-reward ratios, and fewer impulsive decisions. Over time, this disciplined approach helps traders develop confidence and consistency.
How the Stock Market Moves
Understanding why prices move is essential before applying any trading strategy. Every market movement is driven by the interaction between buyers and sellers. When demand exceeds supply, prices rise. When selling pressure becomes stronger than buying interest, prices fall. This constant struggle creates trends, pullbacks, consolidations, and breakouts that traders observe every day.
Institutional investors, mutual funds, hedge funds, banks, and retail traders all participate in this process. Large institutions often execute orders gradually because of their size, creating recognizable price structures that retail traders can learn to identify. These structures include higher highs, higher lows, lower highs, and lower lows. Recognizing these formations helps traders determine whether a market is trending upward, downward, or moving sideways.
Market sentiment also plays a significant role. Positive earnings reports, economic announcements, interest rate decisions, and geopolitical events can shift the balance between buyers and sellers. However, instead of trying to predict every news event, many price action traders prefer to observe how price reacts after the news. This reaction often provides clearer trading opportunities than attempting to forecast headlines.
Demand and Supply
Demand and supply form the foundation of every financial market. Imagine a stock receiving strong buying interest because investors believe its future earnings will exceed expectations. As more buyers compete for limited shares, the stock price rises. Conversely, if investors lose confidence and begin selling aggressively, prices decline until buyers return.
Supply and demand zones are areas on a chart where significant buying or selling previously occurred. These zones often act as future support or resistance because market participants remember those price levels. Traders monitor these areas carefully, looking for signs of rejection, breakouts, or reversals. Understanding these zones helps traders identify logical entry points and manage risk more effectively.
It is important to remember that supply and demand zones are not exact price lines but rather areas where buying and selling activity becomes concentrated. Markets rarely reverse at a single price level. Instead, they often fluctuate within a range before establishing a new direction. Recognizing this behavior helps traders avoid entering trades too early.
Market Structure
Market structure refers to the sequence of highs and lows that define a trend. In an uptrend, prices consistently create higher highs and higher lows. This indicates that buyers remain in control and are willing to purchase at increasingly higher prices. Traders generally look for buying opportunities during pullbacks within these trends rather than attempting to sell against momentum.
A downtrend follows the opposite pattern, producing lower highs and lower lows. Here, sellers dominate the market, and rallies often present opportunities for short-selling or avoiding long positions. Sideways markets occur when buyers and sellers reach temporary equilibrium, causing prices to fluctuate within a defined range. During these periods, breakout strategies often become more effective than trend-following approaches.
Reading market structure enables traders to align themselves with the prevailing trend instead of fighting it. This simple principle significantly improves trading performance because trends tend to persist longer than many beginners expect.
Understanding Candlestick Patterns
Candlestick charts provide a visual representation of price movement during a specific period. Each candlestick displays four key pieces of information: the opening price, closing price, highest price, and lowest price. Together, these values reveal the intensity of buying and selling pressure.
Bullish candlesticks generally close above their opening price, indicating that buyers controlled the session. Bearish candlesticks close below their opening price, showing stronger selling pressure. The size of the candle body and its shadows provide additional clues about market sentiment. Long-bodied candles often reflect strong momentum, while long wicks suggest rejection of higher or lower prices.
Successful traders rarely rely on a single candlestick pattern. Instead, they analyze the broader context, including trend direction, nearby support and resistance, trading volume, and overall market structure. A bullish engulfing pattern appearing at strong support carries greater significance than the same pattern forming in the middle of a sideways range. This contextual analysis separates experienced traders from beginners who memorize patterns without understanding their meaning.
Bullish Candlestick Patterns
Several bullish candlestick formations appear repeatedly across financial markets. The Bullish Engulfing pattern occurs when a large bullish candle completely engulfs the previous bearish candle, signaling that buyers have regained control. Another popular formation is the Hammer, characterized by a small body and a long lower shadow, indicating strong buying interest after sellers initially pushed prices lower.
The Morning Star is another reliable reversal pattern consisting of three candles. It begins with a bearish candle, followed by a small indecisive candle, and concludes with a strong bullish candle. Together, these candles indicate weakening selling pressure and increasing buyer confidence.
While these patterns can provide valuable trading signals, they become significantly more reliable when supported by trend analysis, volume confirmation, and nearby support levels. Price action trading emphasizes combining multiple factors rather than depending on isolated chart formations.
Bearish Candlestick Patterns
Just as bullish patterns indicate increasing buying pressure, bearish candlestick patterns warn traders that sellers may be taking control. Learning to identify these formations helps traders protect profits, avoid poor entries, and even find opportunities to trade short when market conditions allow. These patterns become especially effective when they appear near strong resistance levels or after an extended uptrend. They should always be analyzed alongside trend direction, volume, and overall market structure rather than in isolation.
One of the most recognized bearish formations is the Bearish Engulfing Pattern, where a large bearish candle completely covers the previous bullish candle. This suggests that sellers have overwhelmed buyers. Another important pattern is the Shooting Star, which has a small body and a long upper wick. It shows that buyers attempted to push prices higher but failed, allowing sellers to regain control before the session closed. The Evening Star is another powerful reversal pattern consisting of three candles that often signals the end of an uptrend. Although these patterns increase the probability of a reversal, no single setup guarantees success. Experienced traders wait for confirmation before entering a trade.
Support and Resistance
Support and resistance are among the most important concepts in price action trading. A support level is an area where buying pressure has historically been strong enough to stop prices from falling further. A resistance level is where selling pressure has repeatedly prevented prices from moving higher. These levels represent areas where traders expect price reactions because many market participants make decisions around these zones.
Support and resistance are not exact lines but price zones. Markets rarely reverse at a precise number. Instead, prices often enter a zone, test liquidity, and then move in the expected direction. This is why experienced traders avoid placing entries exactly at support or resistance without confirmation. They wait for candlestick patterns, volume spikes, or strong rejection candles before making decisions. Understanding these levels also helps traders determine logical stop-loss placements and profit targets, improving the overall risk-to-reward ratio.
Dynamic Support and Resistance
Besides horizontal support and resistance, traders also use dynamic support and resistance, which move over time. Popular examples include moving averages and trendlines. During strong uptrends, a rising moving average often acts as dynamic support, while in downtrends it can become dynamic resistance. Trendlines connecting higher lows or lower highs provide additional confirmation of market direction.
Dynamic levels should never replace horizontal levels but rather complement them. When multiple forms of support or resistance align, traders often refer to this as confluence, which increases the probability of a successful trade.
Trend Analysis
Trading with the trend dramatically increases the chances of success. Many beginners try to predict reversals, but experienced traders understand that “the trend is your friend.” Identifying whether the market is trending upward, downward, or moving sideways allows traders to choose strategies that match current market conditions instead of fighting momentum.
Uptrend
An uptrend is characterized by higher highs and higher lows. Buyers remain in control, and pullbacks often present opportunities to join the trend. Instead of chasing rapidly rising prices, disciplined traders wait for temporary corrections toward support before entering new positions. This approach reduces risk while improving entry quality.
Downtrend
A downtrend forms when prices consistently create lower highs and lower lows. Sellers dominate the market, and rallies often fail near resistance. Traders should avoid buying simply because a stock appears “cheap.” Many losing trades occur because beginners mistake a temporary bounce for a complete trend reversal.
Sideways Market
Markets do not trend all the time. During a sideways market, prices move within a defined range without making significant higher highs or lower lows. These periods often frustrate trend-following traders because false breakouts become more common. Range trading strategies or waiting patiently for a confirmed breakout can be more effective than forcing trades during consolidation.
Best Price Action Trading Strategies
There is no universal strategy that works in every market condition. Successful traders adapt their approach based on trend, volatility, and market structure. Here are three of the most widely used price action strategies.
1. Breakout Trading
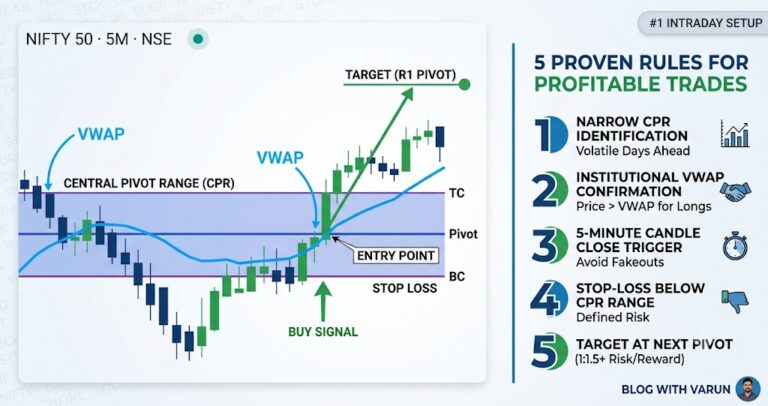
Breakout trading involves entering a trade when price moves decisively above resistance or below support. Genuine breakouts are often accompanied by increased trading volume and strong momentum. Many false breakouts occur because impatient traders enter before confirmation. Waiting for a candle to close beyond the breakout level reduces the chance of being trapped.
2. Pullback Trading
Pullback trading is considered one of the safest approaches because it follows the existing trend. Instead of buying after a large rally, traders wait for price to temporarily retrace toward support before entering. This provides a better entry price and allows for tighter stop-loss placement. Pullbacks also improve the potential reward compared to chasing momentum.
3. Trend Continuation
Trend continuation setups occur when price briefly consolidates before continuing in the direction of the prevailing trend. These pauses represent temporary equilibrium between buyers and sellers before momentum resumes. Recognizing continuation patterns helps traders capitalize on strong market trends without attempting risky reversals.
Risk Management
Even the best trading strategy will fail without proper risk management. Professional traders focus less on winning every trade and more on protecting their capital. A common guideline is to risk only 1% to 2% of total trading capital on a single trade. This ensures that a series of losing trades does not significantly damage the trading account.
Another important principle is maintaining a favorable risk-to-reward ratio. Many experienced traders avoid trades that offer less than a 1:2 ratio. This means risking ₹1 to potentially earn ₹2 or more. By combining disciplined position sizing with consistent risk management, traders can remain profitable even if they win only half of their trades. Capital preservation is the foundation of long-term success.
Trading Psychology
Trading is as much a psychological challenge as it is a technical one. Fear, greed, impatience, and overconfidence influence every decision. Many beginners abandon their trading plans after a few losses or become overly aggressive after several winning trades. Emotional decision-making often leads to inconsistent performance.
Successful traders develop discipline by following predefined rules. They maintain trading journals, review mistakes, and continuously refine their strategies. Accepting losses as a normal part of trading reduces emotional pressure and prevents revenge trading. Consistency comes from executing a proven plan repeatedly rather than searching for a perfect strategy.
Common Mistakes Beginners Make
New traders frequently make avoidable mistakes that delay their progress. Some of the most common include:
| Mistake | Better Approach |
|---|---|
| Trading without a plan | Create and follow a written trading strategy |
| Ignoring stop-loss orders | Always define risk before entering a trade |
| Overtrading | Focus only on high-quality setups |
| Using excessive leverage | Trade with appropriate position sizing |
| Chasing tips on social media | Perform independent analysis |
| Risking too much capital | Limit risk to 1–2% per trade |
| Ignoring market trends | Trade with the prevailing trend |
Avoiding these mistakes can significantly improve consistency. The goal is not to eliminate losses entirely but to ensure that winning trades outweigh losing ones over time.
Conclusion
Price action trading remains one of the most practical and effective approaches for traders because it focuses directly on market behavior rather than relying solely on lagging indicators. By understanding candlestick patterns, market structure, support and resistance, and trend analysis, traders can make more informed decisions based on what price is actually doing.
No strategy guarantees profits, but combining price action with disciplined risk management and strong trading psychology creates a solid foundation for long-term success. Trading is a skill developed through practice, patience, and continuous learning. Instead of searching for shortcuts, focus on mastering the fundamentals and consistently applying your trading plan. Over time, disciplined execution will always outperform emotional decision-making.
Frequently Asked Questions (FAQs)
1. Is price action trading suitable for beginners?
Yes. Price action trading is beginner-friendly because it emphasizes understanding market behavior instead of relying on numerous technical indicators.
2. Which timeframe is best for price action trading?
There is no single best timeframe. Intraday traders often use 5-minute or 15-minute charts, while swing traders prefer 4-hour or daily charts.
3. Can price action trading be used in the Indian stock market?
Absolutely. Price action principles work across NSE, BSE, forex, commodities, cryptocurrencies, and global stock markets.
4. Do I need indicators with price action?
Not necessarily. Many traders use clean charts with little or no indicators, while others combine price action with moving averages or volume for additional confirmation.
5. How long does it take to become profitable?
The learning curve varies for each individual. Consistent profitability typically requires months of study, disciplined practice, proper risk management, and maintaining a trading journal.